AOP ID and Title:
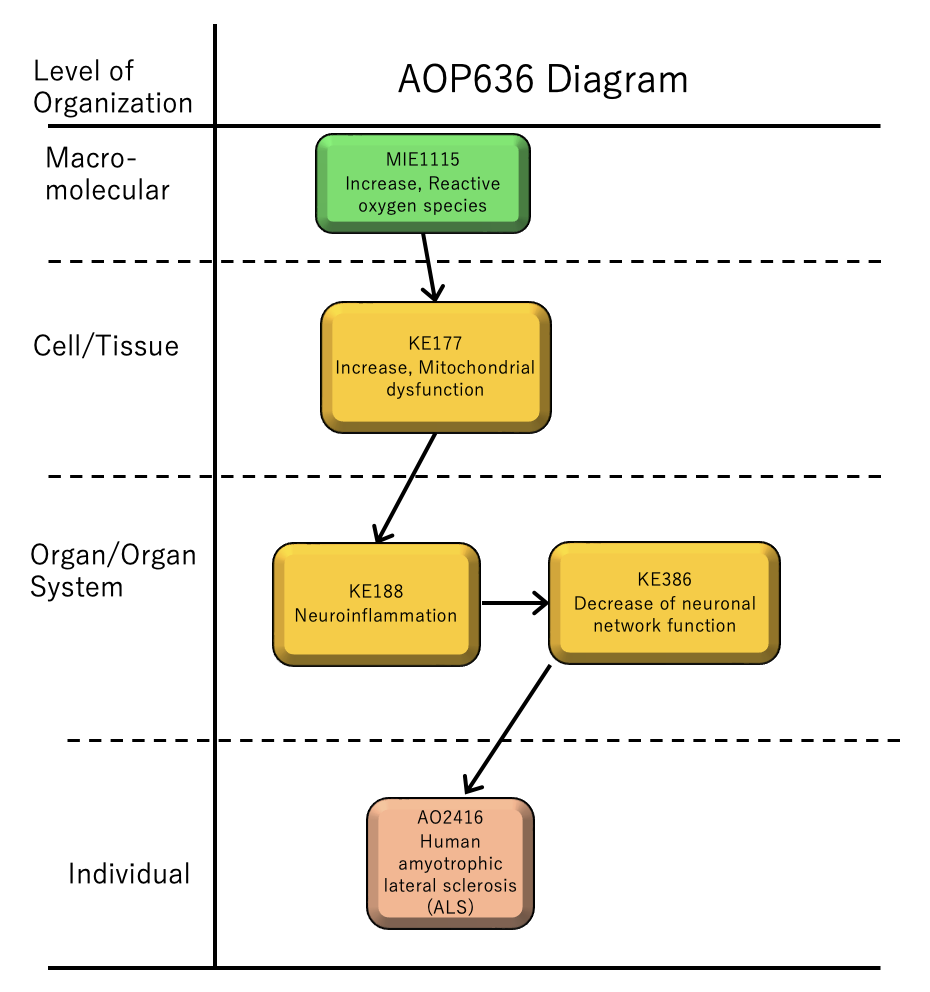
Graphical Representation
Status
| Author status | OECD status | OECD project | SAAOP status |
|---|---|---|---|
| Under development: Not open for comment. Do not cite |
Coaches
- You Song
Abstract
Amyotrophic lateral sclerosis (ALS) is a fatal neurodegenerative disease characterized by the impairment of motor neurons in the brain and spinal cord, leading to skeletal muscle atrophy and eventual death due to respiratory muscle paralysis. Currently, fundamental curative treatments remain unestablished. The objective of this study is to develop an Adverse Outcome Pathway (AOP) for ALS to elucidate its underlying pathological mechanisms. By analyzing molecular networks using RNA-seq data and synthesizing existing literature, we have proposed a draft AOP. This pathway delineates the progression from an initial rise in reactive oxygen species (ROS) and oxidative stress to neurodegeneration and motor neuron death, mediated by key events such as TDP-43 aggregation, mitochondrial dysfunction, neuroinflammation, and axonal transport failure. In developing a quantitative AOP (qAOP), it is essential to assess the quantifiability of each Key Event (KE) and Key Event Relationship (KER) to accurately model the network's functional relationships. Current AOP636 starts with MIE1115, an increase in ROS, links to KE177, an increase in mitochondrial dysfunction, KE188, neuroinflammation, and KE386, a decrease in neuronal network function, and leads to AO2416 human ALS. We need to develop a new KE2416 on ALS and KERs with a quantitative understanding.
Summary of the AOP
Events
Molecular Initiating Events (MIE), Key Events (KE), Adverse Outcomes (AO)
| Sequence | Type | Event ID | Title | Short name |
|---|---|---|---|---|
| MIE | 1115 | Increase, Reactive oxygen species | Increase, ROS | |
| KE | 177 | Increase, Mitochondrial dysfunction | Increase, Mitochondrial dysfunction | |
| KE | 188 | Neuroinflammation | Neuroinflammation | |
| KE | 386 | Decrease of neuronal network function | Neuronal network function, Decreased | |
| AO | 2416 | human amyotrophic lateral sclerosis (ALS) | ALS |
Key Event Relationships
| Upstream Event | Relationship Type | Downstream Event | Evidence | Quantitative Understanding |
|---|---|---|---|---|
| Increase, Reactive oxygen species | adjacent | Increase, Mitochondrial dysfunction | High | |
| Increase, Mitochondrial dysfunction | adjacent | Neuroinflammation | High | |
| Neuroinflammation | adjacent | Decrease of neuronal network function | High | |
| Decrease of neuronal network function | adjacent | human amyotrophic lateral sclerosis (ALS) | High | |
Stressors
| Name | Evidence |
|---|---|
| Reactive oxygen species |
Overall Assessment of the AOP
Domain of Applicability
Life Stage Applicability| Life Stage | Evidence |
|---|---|
| Adult | High |
| Term | Scientific Term | Evidence | Links |
|---|---|---|---|
| Homo sapiens | Homo sapiens | High | NCBI |
| Sex | Evidence |
|---|---|
| Male | High |
| Female | High |
References
Appendix 1
List of MIEs in this AOP
Event: 1115: Increase, Reactive oxygen species
Short Name: Increase, ROS
Event Component
| Process | Object | Action |
|---|---|---|
| reactive oxygen species biosynthetic process | reactive oxygen species | increased |
AOPs Including This Key Event
Biological Context
| Level of Biological Organization |
|---|
| Cellular |
Cell term
| Cell term |
|---|
| cell |
Organ term
| Organ term |
|---|
| organ |
Domain of Applicability
Taxonomic Applicability| Term | Scientific Term | Evidence | Links |
|---|---|---|---|
| Vertebrates | Vertebrates | High | NCBI |
| human | Homo sapiens | Moderate | NCBI |
| human and other cells in culture | human and other cells in culture | Moderate | NCBI |
| mouse | Mus musculus | Moderate | NCBI |
| crustaceans | Daphnia magna | High | NCBI |
| Lemna minor | Lemna minor | High | NCBI |
| zebrafish | Danio rerio | High | NCBI |
| Life Stage | Evidence |
|---|---|
| All life stages | High |
| Sex | Evidence |
|---|---|
| Unspecific | High |
| Mixed | High |
ROS is a normal constituent found in all organisms, lifestages, and sexes.
Key Event Description
Biological State: increased reactive oxygen species (ROS)
Biological compartment: an entire cell -- may be cytosolic, may also enter organelles.
Reactive oxygen species (ROS) are O2- derived molecules that can be both free radicals (e.g. superoxide, hydroxyl, peroxyl, alcoxyl) and non-radicals (hypochlorous acid, ozone and singlet oxygen) (Bedard and Krause 2007; Ozcan and Ogun 2015). ROS production occurs naturally in all kinds of tissues inside various cellular compartments, such as mitochondria and peroxisomes (Drew and Leeuwenburgh 2002; Ozcan and Ogun 2015). Furthermore, these molecules have an important function in the regulation of several biological processes – they might act as antimicrobial agents or triggers of animal gamete activation and capacitation (Goud et al. 2008; Parrish 2010; Bisht et al. 2017).
However, in environmental stress situations (exposure to radiation, chemicals, high temperatures) these molecules have its levels drastically increased, and overly interact with macromolecules, namely nucleic acids, proteins, carbohydrates and lipids, causing cell and tissue damage (Brieger et al. 2012; Ozcan and Ogun 2015).
Reactive oxygen species (ROS) refers to the chemical species superoxide, hydrogen peroxide, and their secondary reactive products. In the biological context, ROS are signaling molecules with important roles in cell energy metabolism, cell proliferation, and fate. Therefore, balancing ROS levels at the cellular and tissue level is an important part of many biological processes. Disbalance, mainly an increase in ROS levels, can cause cell dysfunction and irreversible cell damage.
ROS are produced from both exogenous stressors and normal endogenous cellular processes, such as the mitochondrial electron transport chain (ETC). Inhibition of the ETC can result in the accumulation of ROS. Exposure to chemicals, heavy metal ions, or ionizing radiation can also result in increased production of ROS. Chemicals and heavy metal ions can deplete cellular antioxidants reducing the cell’s ability to control cellular ROS and resulting in the accumulation of ROS. Cellular antioxidants include glutathione (GSH), protein sulfhydryl groups, superoxide dismutase (SOD).
ROS are radicals, ions, or molecules that have a single unpaired electron in their outermost shell of electrons, which can be categorized into two groups: free oxygen radicals and non-radical ROS [Liou et al., 2010].
<Free oxygen radicals>
|
superoxide |
O2·- |
|
hydroxyl radical |
·OH |
|
nitric oxide |
NO· |
|
organic radicals |
R· |
|
peroxyl radicals |
ROO· |
|
alkoxyl radicals |
RO· |
|
thiyl radicals |
RS· |
|
sulfonyl radicals |
ROS· |
|
thiyl peroxyl radicals |
RSOO· |
|
disulfides |
RSSR |
<Non-radical ROS>
|
hydrogen peroxide |
H2O2 |
|
singlet oxygen |
1O2 |
|
ozone/trioxygen |
O3 |
|
organic hydroperoxides |
ROOH |
|
hypochlorite |
ClO- |
|
peroxynitrite |
ONOO- |
|
nitrosoperoxycarbonate anion |
O=NOOCO2- |
|
nitrocarbonate anion |
O2NOCO2- |
|
dinitrogen dioxide |
N2O2 |
|
nitronium |
NO2+ |
|
highly reactive lipid- or carbohydrate-derived carbonyl compounds |
|
Potential sources of ROS include NADPH oxidase, xanthine oxidase, mitochondria, nitric oxide synthase, cytochrome P450, lipoxygenase/cyclooxygenase, and monoamine oxidase [Granger et al., 2015]. ROS are generated through NADPH oxidases consisting of p47phox and p67phox. ROS are generated through xanthine oxidase activation in sepsis [Ramos et al., 2018]. Arsenic produces ROS [Zhang et al., 2011]. Mitochondria-targeted paraquat and metformin mediate ROS production [Chowdhury et al., 2020]. ROS are generated by bleomycin [Lu et al., 2010]. Radiation induces dose-dependent ROS production [Ji et al., 2019].
ROS are generated in the course of cellular respiration, metabolism, cell signaling, and inflammation [Dickinson and Chang 2011; Egea et al. 2017]. Hydrogen peroxide is also made by the endoplasmic reticulum in the course of protein folding. Nitric oxide (NO) is produced at the highest levels by nitric oxide synthase in endothelial cells and phagocytes. NO production is one of the main mechanisms by which phagocytes kill bacteria [Wang et al., 2017]. The other species are produced by reactions with superoxide or peroxide, or by other free radicals or enzymes.
ROS activity is principally local. Most ROS have short half-lives, ranging from nano- to milliseconds, so diffusion is limited, while reactive nitrogen species (RNS) nitric oxide or peroxynitrite can survive long enough to diffuse across membranes [Calcerrada et al. 2011]. Consequently, local concentrations of ROS are much higher than average cellular concentrations, and signaling is typically controlled by colocalization with redox buffers [Dickinson and Chang 2011; Egea et al. 2017].
Although their existence is limited temporally and spatially, ROS interact with other ROS or with other nearby molecules to produce more ROS and participate in a feedback loop to amplify the ROS signal, which can increase RNS. Both ROS and RNS also move into neighboring cells, and ROS can increase intracellular ROS signaling in neighboring cells [Egea et al. 2017].
In the primary event, photoreactive chemicals are excited by the absorption of photon energy. The energy of the photoactivated chemicals transfer to oxygen and then generates the reactive oxygen species (ROS), including superoxide (O2−) via type I reaction and singlet oxygen (1O2) via type II reaction, as principal intermediate species in phototoxic reaction (Foote, 1991, Onoue et al. , 2009).
How it is Measured or Detected
Photocolorimetric assays (Sharma et al. 2017; Griendling et al. 2016) or through commercial kits purchased from specialized companies.
Yuan, Yan, et al., (2013) described ROS monitoring by using H2-DCF-DA, a redox-sensitive fluorescent dye. Briefly, the harvested cells were incubated with H2-DCF-DA (50 µmol/L final concentration) for 30 min in the dark at 37°C. After treatment, cells were immediately washed twice, re-suspended in PBS, and analyzed on a BD-FACS Aria flow cytometry. ROS generation was based on fluorescent intensity which was recorded by excitation at 504 nm and emission at 529 nm.
Lipid peroxidation (LPO) can be measured as an indicator of oxidative stress damage Yen, Cheng Chien, et al., (2013).
Chattopadhyay, Sukumar, et al. (2002) assayed the generation of free radicals within the cells and their extracellular release in the medium by addition of yellow NBT salt solution (Park et al., 1968). Extracellular release of ROS converted NBT to a purple colored formazan. The cells were incubated with 100 ml of 1 mg/ml NBT solution for 1 h at 37 °C and the product formed was assayed at 550 nm in an Anthos 2001 plate reader. The observations of the ‘cell-free system’ were confirmed by cytological examination of parallel set of explants stained with chromogenic reactions for NO and ROS.
On the basis of the pathogenesis of drug-induced phototoxicity, a reactive oxygen species (ROS) assay was proposed to evaluate the phototoxic risk of chemicals. The ROS assay can monitor generation of ROS, such as singlet oxygen and superoxide, from photoirradiated chemicals, and the ROS data can be used to evaluate the photoreactivity of chemicals (Onoue et al. , 2014, Onoue et al. , 2013, Onoue and Tsuda, 2006). The ROS assay is a recommended approach by guidelines to evaluate the phototoxic risk of chemicals (ICH, 2014, PCPC, 2014).
<Direct detection>
Many fluorescent compounds can be used to detect ROS, some of which are specific, and others are less specific.
・ROS can be detected by fluorescent probes such as p-methoxy-phenol derivative [Ashoka et al., 2020].
・Chemiluminescence analysis can detect the superoxide, where some probes have a wider range for detecting hydroxyl radical, hydrogen peroxide, and peroxynitrite [Fuloria et al., 2021].
・ROS in the blood can be detected using superparamagnetic iron oxide nanoparticles (SPION)-based biosensor [Lee et al., 2020].
・Hydrogen peroxide (H2O2) can be detected with a colorimetric probe, which reacts with H2O2 in a 1:1 stoichiometry to produce a bright pink colored product, followed by the detection with a standard colorimetric microplate reader with a filter in the 540-570 nm range.
・The levels of ROS can be quantified using multiple-step amperometry using a stainless steel counter electrode and non-leak Ag|AgCl reference node [Flaherty et al., 2017].
・Singlet oxygen can be measured by monitoring the bleaching of p-nitrosodimethylaniline at 440 nm using a spectrophotometer with imidazole as a selective acceptor of singlet oxygen [Onoue et al., 2014].
<Indirect Detection>
Alternative methods involve the detection of redox-dependent changes to cellular constituents such as proteins, DNA, lipids, or glutathione [Dickinson and Chang 2011; Wang et al. 2013; Griendling et al. 2016]. However, these methods cannot generally distinguish between the oxidative species behind the changes and cannot provide good resolution for the kinetics of oxidative activity.
References
Akai, K., et al. (2004). "Ability of ferric nitrilotriacetate complex with three pH-dependent conformations to induce lipid peroxidation." Free Radic Res. Sep;38(9):951-62. doi: 10.1080/1071576042000261945
Ashoka, A. H., et al. (2020). "Recent Advances in Fluorescent Probes for Detection of HOCl and HNO." ACS omega, 5(4), 1730-1742. doi:10.1021/acsomega.9b03420
B.H. Park, S.M. Fikrig, E.M. Smithwick Infection and nitroblue tetrazolium reduction by neutrophils: a diagnostic aid Lancet, 2 (1968), pp. 532-534
Bedard, Karen, and Karl-Heinz Krause. 2007. “The NOX Family of ROS-Generating NADPH Oxidases: Physiology and Pathophysiology.” Physiological Reviews 87 (1): 245–313.
Bisht, Shilpa, Muneeb Faiq, Madhuri Tolahunase, and Rima Dada. 2017. “Oxidative Stress and Male Infertility.” Nature Reviews. Urology 14 (8): 470–85.
Brieger, K., S. Schiavone, F. J. Miller Jr, and K-H Krause. 2012. “Reactive Oxygen Species: From Health to Disease.” Swiss Medical Weekly 142 (August): w13659.
Calcerrada, P., et al. (2011). "Nitric oxide-derived oxidants with a focus on peroxynitrite: molecular targets, cellular responses and therapeutic implications." Curr Pharm Des 17(35): 3905-3932.
Chattopadhyay, Sukumar, et al. "Apoptosis and necrosis in developing brain cells due to arsenic toxicity and protection with antioxidants." Toxicology letters 136.1 (2002): 65-76.
Chowdhury, A. R., et al. (2020). "Mitochondria-targeted paraquat and metformin mediate ROS production to induce multiple pathways of retrograde signaling: A dose-dependent phenomenon." Redox Biol. doi: 10.1016/j.redox.2020.101606. PMID: 32604037; PMCID: PMC7327929.
Dickinson, B. C. and Chang C. J. (2011). "Chemistry and biology of reactive oxygen species in signaling or stress responses." Nature chemical biology 7(8): 504-511.
Drew, Barry, and Christiaan Leeuwenburgh. 2002. “Aging and the Role of Reactive Nitrogen Species.” Annals of the New York Academy of Sciences 959 (April): 66–81.
Egea, J., et al. (2017). "European contribution to the study of ROS: A summary of the findings and prospects for the future from the COST action BM1203 (EU-ROS)." Redox biology 13: 94-162.
Flaherty, R. L., et al. (2017). "Glucocorticoids induce production of reactive oxygen species/reactive nitrogen species and DNA damage through an iNOS mediated pathway in breast cancer." Breast Cancer Research, 19(1), 1–13. https://doi.org/10.1186/s13058-017-0823-8
Foote CS. Definition of type I and type II photosensitized oxidation. Photochem Photobiol. 1991;54:659.
Fuloria, S., et al. (2021). "Comprehensive Review of Methodology to Detect Reactive Oxygen Species (ROS) in Mammalian Species and Establish Its Relationship with Antioxidants and Cancer." Antioxidants (Basel, Switzerland) 10(1) 128. doi:10.3390/antiox10010128
Go, Y. M. and Jones, D. P. (2013). "The redox proteome." J Biol Chem 288(37): 26512-26520.
Goud, Anuradha P., Pravin T. Goud, Michael P. Diamond, Bernard Gonik, and Husam M. Abu-Soud. 2008. “Reactive Oxygen Species and Oocyte Aging: Role of Superoxide, Hydrogen Peroxide, and Hypochlorous Acid.” Free Radical Biology & Medicine 44 (7): 1295–1304.
Granger, D. N. and Kvietys, P. R. (2015). "Reperfusion injury and reactive oxygen species: The evolution of a concept" Redox Biol. doi: 10.1016/j.redox.2015.08.020. PMID: 26484802; PMCID: PMC4625011.
Griendling, K. K., et al. (2016). "Measurement of Reactive Oxygen Species, Reactive Nitrogen Species, and Redox-Dependent Signaling in the Cardiovascular System: A Scientific Statement From the American Heart Association." Circulation research 119(5): e39-75.
Griendling, Kathy K., Rhian M. Touyz, Jay L. Zweier, Sergey Dikalov, William Chilian, Yeong-Renn Chen, David G. Harrison, Aruni Bhatnagar, and American Heart Association Council on Basic Cardiovascular Sciences. 2016. “Measurement of Reactive Oxygen Species, Reactive Nitrogen Species, and Redox-Dependent Signaling in the Cardiovascular System: A Scientific Statement From the American Heart Association.” Circulation Research 119 (5): e39–75.
ICH. ICH Guideline S10 Guidance on Photosafety Evaluation of Pharmaceuticals.: International Council on Harmonisation of Technical Requirements for Registration of Pharmaceuticals for Human Use; 2014.
Itziou, A., et al. (2011). "In vivo and in vitro effects of metals in reactive oxygen species production, protein carbonylation, and DNA damage in land snails Eobania vermiculata." Archives of Environmental Contamination and Toxicology, 60(4), 697–707. https://doi.org/10.1007/s00244-010-9583-5
Ji, W. O., et al. "Quantitation of the ROS production in plasma and radiation treatments of biotargets." Sci Rep. 2019 Dec 27;9(1):19837. doi: 10.1038/s41598-019-56160-0. PMID: 31882663; PMCID: PMC6934759.
Kruk, J. and Aboul-Enein, H. Y. (2017). "Reactive Oxygen and Nitrogen Species in Carcinogenesis: Implications of Oxidative Stress on the Progression and Development of Several Cancer Types." Mini-Reviews in Medicinal Chemistry, 17:11. doi:10.2174/1389557517666170228115324
Lee, D. Y., et al. (2020). "PEGylated Bilirubin-coated Iron Oxide Nanoparticles as a Biosensor for Magnetic Relaxation Switching-based ROS Detection in Whole Blood." Theranostics, 10(5), 1997-2007. doi:10.7150/thno.39662
Li, Z., et al. (2020). "Inhibition of MiR-25 attenuates doxorubicin-induced apoptosis, reactive oxygen species production and DNA damage by targeting pten." International Journal of Medical Sciences, 17(10), 1415–1427. https://doi.org/10.7150/ijms.41980
Liou, G. Y. and Storz, P. "Reactive oxygen species in cancer." Free Radic Res. 2010 May;44(5):479-96. doi:10.3109/10715761003667554. PMID: 20370557; PMCID: PMC3880197.
Lu, Y., et al. (2010). "Phosphatidylinositol-3-kinase/akt regulates bleomycin-induced fibroblast proliferation and collagen production." American journal of respiratory cell and molecular biology, 42(4), 432–441. https://doi.org/10.1165/rcmb.2009-0002OC
Onoue, S., et al. (2013). "Establishment and intra-/inter-laboratory validation of a standard protocol of reactive oxygen species assay for chemical photosafety evaluation." J Appl Toxicol. 33(11):1241-50. doi: 10.1002/jat.2776. Epub 2012 Jun 13. PMID: 22696462.
Onoue S, Hosoi K, Toda T, Takagi H, Osaki N, Matsumoto Y, et al. Intra-/inter-laboratory validation study on reactive oxygen species assay for chemical photosafety evaluation using two different solar simulators. Toxicology in vitro : an international journal published in association with BIBRA. 2014;28:515-23.
Onoue S, Hosoi K, Wakuri S, Iwase Y, Yamamoto T, Matsuoka N, et al. Establishment and intra-/inter-laboratory validation of a standard protocol of reactive oxygen species assay for chemical photosafety evaluation. Journal of applied toxicology : JAT. 2013;33:1241-50.
Onoue S, Kawamura K, Igarashi N, Zhou Y, Fujikawa M, Yamada H, et al. Reactive oxygen species assay-based risk assessment of drug-induced phototoxicity: classification criteria and application to drug candidates. J Pharm Biomed Anal. 2008;47:967-72.
Onoue S, Seto Y, Gandy G, Yamada S. Drug-induced phototoxicity; an early in vitro identification of phototoxic potential of new drug entities in drug discovery and development. Current drug safety. 2009;4:123-36.
Onoue S, Tsuda Y. Analytical studies on the prediction of photosensitive/phototoxic potential of pharmaceutical substances. Pharmaceutical research. 2006;23:156-64.
Ozcan, Ayla, and Metin Ogun. 2015. “Biochemistry of Reactive Oxygen and Nitrogen Species.” In Basic Principles and Clinical Significance of Oxidative Stress, edited by Sivakumar Joghi Thatha Gowder. Rijeka: IntechOpen.
Parrish, A. R. 2010. “2.27 - Hypoxia/Ischemia Signaling.” In Comprehensive Toxicology (Second Edition), edited by Charlene A. McQueen, 529–42. Oxford: Elsevier.
PCPC. PCPC 2014 safety evaluation guidelines; Chapter 7: Evaluation of Photoirritation and Photoallergy potential. Personal Care Products Council; 2014.
Ramos, M. F. P., et al. (2018). "Xanthine oxidase inhibitors and sepsis." Int J Immunopathol Pharmacol. 32:2058738418772210. doi:10.1177/2058738418772210
Ravanat, J. L., et al. (2014). "Radiation-mediated formation of complex damage to DNA: a chemical aspect overview." Br J Radiol 87(1035): 20130715.
Schutzendubel, A. and Polle, A. (2002). "Plant responses to abiotic stresses: heavy metal-induced oxidative stress and protection by mycorrhization." Journal of Experimental Botany, 53(372), 1351–1365. https://doi.org/10.1093/jexbot/53.372.1351
Seto Y, Kato M, Yamada S, Onoue S. Development of micellar reactive oxygen species assay for photosafety evaluation of poorly water-soluble chemicals. Toxicology in vitro : an international journal published in association with BIBRA. 2013;27:1838-46.
Sharma, Gunjan, Nishant Kumar Rana, Priya Singh, Pradeep Dubey, Daya Shankar Pandey, and Biplob Koch. 2017. “p53 Dependent Apoptosis and Cell Cycle Delay Induced by Heteroleptic Complexes in Human Cervical Cancer Cells.” Biomedicine & Pharmacotherapy = Biomedecine & Pharmacotherapie 88 (April): 218–31.
Silva, R., et al. (2019). "Light exposure during growth increases riboflavin production, reactive oxygen species accumulation and DNA damage in Ashbya gossypii riboflavin-overproducing strains." FEMS Yeast Research, 19(1), 1–7. https://doi.org/10.1093/femsyr/foy114
Tsuchiya K, et al. (2005). "Oxygen radicals photo-induced by ferric nitrilotriacetate complex." Biochim Biophys Acta. 1725(1):111-9. doi:10.1016/j.bbagen.2005.05.001
Wang, J., et al. (2017). "Glucocorticoids Suppress Antimicrobial Autophagy and Nitric Oxide Production and Facilitate Mycobacterial Survival in Macrophages." Scientific reports, 7(1), 982. https://doi.org/10.1038/s41598-017-01174-9
Wang, X., et al. (2013). "Imaging ROS signaling in cells and animals." Journal of molecular medicine 91(8): 917-927.
Yen, Cheng Chien, et al. "Inorganic arsenic causes cell apoptosis in mouse cerebrum through an oxidative stress-regulated signaling pathway." Archives of toxicology 85 (2011): 565-575.
Yuan, Yan, et al. "Cadmium-induced apoptosis in primary rat cerebral cortical neurons culture is mediated by a calcium signaling pathway." PloS one 8.5 (2013): e64330.
Zhang, Z., et al. (2011). "Reactive oxygen species mediate arsenic induced cell transformation and tumorigenesis through Wnt/β-catenin pathway in human colorectal adenocarcinoma DLD1 cells. " Toxicology and Applied Pharmacology, 256(2), 114-121. doi:10.1016/j.taap.2011.07.016
List of Key Events in the AOP
Event: 177: Increase, Mitochondrial dysfunction
Short Name: Increase, Mitochondrial dysfunction
Event Component
| Process | Object | Action |
|---|---|---|
| mitochondrion | functional change |
AOPs Including This Key Event
Stressors
| Name |
|---|
| Uranium |
| Nanoparticles and Micrometer Particles |
| Cadmium |
Biological Context
| Level of Biological Organization |
|---|
| Cellular |
Cell term
| Cell term |
|---|
| eukaryotic cell |
Organ term
| Organ term |
|---|
| organ |
Domain of Applicability
Taxonomic Applicability| Term | Scientific Term | Evidence | Links |
|---|---|---|---|
| human | Homo sapiens | High | NCBI |
| mouse | Mus musculus | High | NCBI |
| rat | Rattus norvegicus | High | NCBI |
| Drosophila melanogaster | Drosophila melanogaster | High | NCBI |
| Caenorhabditis elegans | Caenorhabditis elegans | High | NCBI |
| Life Stage | Evidence |
|---|---|
| All life stages |
| Sex | Evidence |
|---|---|
| Male | High |
| Female | High |
Mitochondrial dysfunction is a universal event occurring in cells of any species (Farooqui and Farooqui, 2012). Many invertebrate species (drosophila, C, elegans) are considered as potential models to study mitochondrial function. New data on marine invertebrates, such as molluscs and crustaceans and non-Drosophila species, are emerging (Martinez-Cruz et al., 2012). Mitochondrial dysfunction can be measured in animal models used for toxicity testing (Winklhofer and Haass, 2010; Waerzeggers et al., 2010) as well as in humans (Winklhofer and Haass, 2010).
- Revision of AOP3 (Project: NP/EFSA/PREV/2024/02): Endogenous ROS formation by complex I: In mammals, complex I is a dominant site of mitochondrial ROS, especially via RET. In plants (Senkler et al. 2017; Maldonado), mitochondria contain alternative NAD(P)H dehydrogenases and an alternative oxidase (AOX) that bypass Complex I and III These pathways reduce ROS formation by preventing over-reduction of the ETC. Complex I still produces ROS, but generally less damaging due to AOX. Yeast: S. cerevisiae lacks a canonical Complex I entirely, relying instead on alternative NADH dehydrogenases. Consequently, mitochondrial ROS production from a Complex I-like source is absent. Other fungi with true Complex I (e.g., Neurospora crassa) do generate ROS similar to animals. - Not endorsed
Key Event Description
Mitochondrial dysfunction is a consequence of inhibition of the respiratory chain leading to oxidative stress.
Mitochondria can be found in all cells and are considered the most important cellular consumers of oxygen. Furthermore, mitochondria possess numerous redox enzymes capable of transferring single electrons to oxygen, generating the superoxide (O2-). Some mitochondrial enzymes that are involved in reactive oxygen species (ROS) generation include the electron-transport chain (ETC) complexes I, II and III; pyruvate dehydrogenase (PDH) and glycerol-3-phosphate dehydrogenase (GPDH). The transfer of electrons to oxygen, generating superoxide, happens mainly when these redox carriers are charged enough with electrons and the potential energy for transfer is elevated, like in the case of high mitochondrial membrane potential. In contrast, ROS generation is decreased if there are not enough electrons and the potential energy for the transfer is not sufficient (reviewed in Lin and Beal, 2006).
Cells are also able to detoxify the generated ROS due to an extensive antioxidant defence system that includes superoxide dismutases, glutathione peroxidases, catalase, thioredoxins, and peroxiredoxins in various cell organelles (reviewed in Lin and Beal, 2006). It is worth mentioning that, as in the case of ROS generation, antioxidant defences are also closely related to the redox and energetic status of mitochondria. If mitochondria are structurally and functionally healthy, an antioxidant defence mechanism balances ROS generation, and there is not much available ROS production. However, in case of mitochondrial damage, the antioxidant defence capacity drops and ROS generation takes over. Once this happens, a vicious cycle starts and ROS can further damage mitochondria, leading to more free-radical generation and further loss of antioxidant capacity. During mitochondrial dysfunction the availability of ATP also decreases, which is considered necessary for repair mechanisms after ROS generation.
A number of proteins bound to the mitochondria or endoplasmic reticulum (ER), especially in the mitochondria-associated ER membrane (MAM), are playing an important role of communicators between these two organelles (reviewed Mei et al., 2013). ER stress induces mitochondrial dysfunction through regulation of Ca2+ signaling and ROS production (reviewed Mei et al., 2013). Prolonged ER stress leads to release of Ca2+ at the MAM and increased Ca2+ uptake into the mitochondrial matrix, which induces Ca2+-dependent mitochondrial outer membrane permeabilization and apoptosis. At the same, ROS are produced by proteins in the ER oxidoreductin 1 (ERO1) family. ER stress activates ERO1 and leads to excessive production of ROS, which, in turn, inactivates SERCA and activates inositol-1,4,5- trisphosphate receptors (IP3R) via oxidation, resulting in elevated levels of cytosolic Ca2+, increased mitochondrial uptake of Ca2+, and ultimately mitochondrial dysfunction. Just as ER stress can lead to mitochondrial dysfunction, mitochondrial dysfunction also induces ER Stress (reviewed Mei et al., 2013). For example, nitric oxide disrupts the mitochondrial respiratory chain and causes changes in mitochondrial Ca2+ flux which induce ER stress. Increased Ca2+ flux triggers loss of mitochondrial membrane potential (MMP), opening of mitochondrial permeability transition pore (mPTP), release of cytochrome c and apoptosis inducing factor (AIF), decreasing ATP synthesis and rendering the cells more vulnerable to both apoptosis and necrosis (Wang and Qin, 2010).
Metal-induced Mitochondrial Dysfunction
Mitochondria are an important site of Ca2+ regulation and storage, taking up Ca2+ ions electrophoretically from the cytosol through a Ca2+ uniporter, which can then accumulate in the mitochondria (Roos et al., 2012; Orrenius et al., 2015). Similarities between calcium and metals, such as cadmium and lead, makes the entrance and accumulation of these metals into the mitochondria via calcium metals possible by mode of molecular mimicry (Mathews et al., 2013; Adiele et al., 2012). The outer mitochondrial membrane also contains the divalent metal transporter (DMT1), which allows for mitochondrial uptake of divalent metals such as Fe and Mn. When cells are under heavy metal-induced stress, DMT has been shown to be overexpressed in the mitochondrial membrane, making the mitochondria targets of metal toxicity and accumulation.
Heavy metal exposure in aerobic organisms increases ROS formation through redox cycling, where metals with different valence states (Fe, Cu, Cr, etc.) directly produce ROS as they are reduced by cellular antioxidants and then react with oxygen (Shaki et al., 2012; Shaki et al., 2013; Pourahmad et al., 2006; Santos et al., 2007). The production of highly reactive hydroxyl radicals under mitochondrial oxidative stress and in the presence of transition metals occurs via the Fenton reaction or Haber-Weiss reaction (Hancock et al., 2001; Valko et al., 2005; Adam-Vizi et al., 2010). Metals and ROS are capable of damaging mitochondrial DNA as well as mechanisms of DNA repair and proliferation arrest (Valko et al., 2005). Metals and ROS have the potential to directly damage mitochondrial membranes and structure by binding to and oxidizing membrane lipids and proteins. This structural damage can collapse the MMP and lead to the opening of the MPTP (Orrenius et al., 2015; Roos et al., 2012; Pourahmad et al., 2006). Uranium and mercury, for example, have both been shown to directly inhibit the mitochondrial electron transport chain and interfere with ATP production (Shaki et al., 2012; Roos et al., 2012). Furthermore, as previously mentioned, metals have been shown to inhibit ROS-detoxifying enzymes. By binding to these enzymes, metals can inhibit their antioxidant functions, and cause an accumulation of ROS and increased synthesis of more antioxidant enzymes in order to combat the oxidative stress (Blajszczak and Bonini, 2017).
Summing up: Mitochondria play a pivotal role in cell survival and cell death because they are regulators of both energy metabolism and apoptotic/necrotic pathways (Fiskum, 2000; Wieloch, 2001; Friberg and Wieloch, 2002). The production of ATP via oxidative phosphorylation is a vital mitochondrial function (Kann and Kovács, 2007; Nunnari and Suomalainen, 2012). The ATP is continuously required for signalling processes (e.g. Ca2+ signalling), maintenance of ionic gradients across membranes, and biosynthetic processes (e.g. protein synthesis, heme synthesis or lipid and phospholipid metabolism) (Kang and Pervaiz, 2012), and (Green, 1998; McBride et al., 2006). Inhibition of mitochondrial respiration contributes to various cellular stress responses, such as deregulation of cellular Ca2+ homeostasis (Graier et al., 2007) and ROS production (Nunnari and Suomalainen, 2012; reviewed Mei et al., 2013).). It is well established in the existing literature that mitochondrial dysfunction may result in: (a) an increased ROS production and a decreased ATP level, (b) the loss of mitochondrial protein import and protein biosynthesis, (c) the reduced activities of enzymes of the mitochondrial respiratory chain and the Krebs cycle, (d) the loss of the mitochondrial membrane potential, (e) the loss of mitochondrial motility, causing a failure to re-localize to the sites with increased energy demands (f) the destruction of the mitochondrial network, and (g) increased mitochondrial Ca2+ uptake, causing Ca2+ overload (reviewed in Lin and Beal, 2006; Graier et al., 2007), (h) the rupture of the mitochondrial inner and outer membranes, leading to (i) the release of mitochondrial pro-death factors, including cytochrome c (Cyt. c), apoptosis-inducing factor, or endonuclease G (Braun, 2012; Martin, 2011; Correia et al., 2012; Cozzolino et al., 2013), which eventually leads to apoptotic, necrotic or autophagic cell death (Wang and Qin, 2010). Due to their structural and functional complexity, mitochondria present multiple targets for various compounds.
How it is Measured or Detected
Mitochondrial dysfunction can be detected using isolated mitochondria, intact cells or cells in culture as well as in vivo studies. Such assessment can be performed with a large range of methods (revised by Brand and Nicholls, 2011) for which some important examples are given. All approaches to assess mitochondrial dysfunction fall into two main categories: the first assesses the consequences of a loss-of-function, i.e. impaired functioning of the respiratory chain and processes linked to it. Some assay to assess this have been described for KE1, with the limitation that they are not specific for complex I. In the context of overall mitochondrial dysfunction, the same assays provide useful information, when performed under slightly different assay conditions (e.g. without addition of complex III and IV inhibitors). The second approach assesses a ‘non-desirable gain-of-function’, i.e. processes that are usually only present to a very small degree in healthy cells, and that are triggered in a cell, in which mitochondria fail.
I. Mitochondrial dysfunction assays assessing a loss-of function.
1. Cellular oxygen consumption.
See KE1 for details of oxygen consumption assays. The oxygen consumption parameter can be combined with other endpoints to derive more specific information on the efficacy of mitochondrial function. One approach measures the ADP-to-O ratio (the number of ADP molecules phosphorylated per oxygen atom reduced (Hinkle, 1995 and Hafner et al., 1990). The related P/O ratio is calculated from the amount of ADP added, divided by the amount of O2 consumed while phosphorylating the added ADP (Ciapaite et al., 2005; Diepart et al., 2010; Hynes et al., 2006; James et al., 1995; von Heimburg et al., 2005).
2. Mitochondrial membrane potential (Δψm ).
- Revision of AOP3 (Project: NP/EFSA/PREV/2024/02): The mitochondrial membrane potential (Δψm) is the electric potential difference across the inner mitochondrial membrane. It requires a functioning respiratory chain in the absence of mechanisms that dissipate the proton gradient without coupling it to ATP production. Quantitative assessment of ΔΨm in living cells is most commonly achieved through the use of cationic, lipophilic fluorescent probes that accumulate within the mitochondrial matrix in proportion to the electrochemical gradient (Leonard et al., 2014). Among these, tetramethylrhodamine derivatives such as TMRE (tetramethylrhodamine ethyl ester) and TMRM (tetramethylrhodamine methyl ester) are widely employed due to their reversible, potential-dependent distribution across the inner mitochondrial membrane (Scaduto and Grotyohann, 1999; Creed and McKenzie, 2019). When applied at non-quenching, nanomolar concentrations, these dyes allow linear and quantitative detection of ΔΨm, as fluorescence intensity directly correlates with mitochondrial polarization. Detection can be performed by flow cytometry for population-level quantification, by high-content microscopy for spatially resolved analysis, or by fluorescence plate readers for higher throughput (Wong and Cortopassi, 2002; Valdebenito and Dunchen, 2022). Quantitative interpretation requires the use of appropriate controls, typically involving treatment with protonophores such as FCCP or CCCP, which fully dissipate ΔΨm and thereby establish baseline fluorescence, and inhibitors such as oligomycin or antimycin A to reveal different components of mitochondrial respiration. In parallel, dyes such as JC-1 are also used, though their ratiometric readout is less sensitive at low potentials and more prone to artifacts compared with TMRE or TMRM (Leonard et al., 2022). For accurate normalization, measurements are often corrected for cell number, mitochondrial content, or total protein, and fluorescence changes are expressed relative to maximal depolarization. In addition to chemical probes, genetically encoded sensors, such as mitochondria-targeted fluorescent proteins fused to potential-sensitive domains, provide complementary tools for ΔΨm monitoring in live-cell and in vivo contexts (Leonard et al., 2022). - Not endorsed
3. Enzymatic activity of the electron transport system (ETS).
Determination of ETS activity can be dene following Owens and King's assay (1975). The technique is based on a cell-free homogenate that is incubated with NADH to saturate the mitochondrial ETS and an artificial electron acceptor [l - (4 -iodophenyl) -3 - (4 -nitrophenyl) -5-phenylte trazolium chloride (INT)] to register the electron transmission rate. The oxygen consumption rate is calculated from the molar production rate of INT-formazan which is determined spectrophotometrically (Cammen et al., 1990).
4. ATP content.
For the evaluation of ATP levels, various commercially-available ATP assay kits are offered based on luciferin and luciferase activity. For isolated mitochondria various methods are available to continuously measure ATP with electrodes (Laudet 2005), with luminometric methods, or for obtaining more information on different nucleotide phosphate pools (e.g. Ciapaite et al., (2005).
- Revision of AOP3 (Project: NP/EFSA/PREV/2024/02):
Determination of mitochondrial ATP production based on extracellular flux analysis
The method is based on the detection of OCR (Oxygen Consumption Rate) that represents mitochondrial respiration as well as on the detection of ECAR (extracellular acidification rate) / proton efflux rate (PER): reflects extracellular acidification, a proxy for glycolysis (lactate release) plus contributions from CO₂/HCO₃⁻. PER is preferred over raw ECAR since it corrects for CO₂-derived acidification (Desousa et al., 2023; Espinosa et al., 2022). Application of inhibitors of individual complexes of the respiratory chain allows the detection of ATP-linked OCR: portion of oxygen consumption directly driving ATP synthesis (lost after ATP synthase inhibition) (Yoo et al., 2024). The proton leak & non-mitochondrial OCR represents remaining oxygen consumption after ATP synthase and electron transport chain inhibitor addition. The difference yields the ATP-coupled respiration component.
Calculation of mitochondrial ATP production
Mito ATP production rate (pmol ATP/min) = OCRATP (pmol O2/min) × 2 × P/O
OCR_ATP: ATP-coupled portion of OCR.
Factor 2: each O₂ molecule contains two oxygen atoms.
P/O ratio: number of ATP molecules synthesized per oxygen atom reduced. A mean P/O ≈ 2.75 is typically assumed (validated across many cell types but substrate- and condition-dependent) (Plitzko and Loesgen, 2018; Mookerjee et al., 2017; Motawe et al., 2024).
Limitations
P/O ratio varies by substrate (glucose vs. fatty acids), cell type, and conditions. Fixed values are approximations.
Non-mitochondrial oxygen consumption (oxidases, peroxidases, etc.) can confound OCR, hence use of ETC inhibitors.
PER vs. ECAR: CO₂-driven acidification must be corrected to avoid overestimating glycolytic ATP.
Normalization: results are usually expressed per cell, protein content, DNA, or mitochondrial mass — interpretation depends on normalization method.
- Not endorsed
II. Mitochondrial dysfunction assays assessing a gain-of function.
1. Mitochondrial permeability transition pore opening (PTP).
The opening of the PTP is associated with a permeabilization of mitochondrial membranes, so that different compounds and cellular constituents can change intracellular localization. This can be measured by assessment of the translocation of cytochrome c, adenylate kinase or AIF from mitochondria to the cytosol or nucleus. The translocation can be assessed biochemically in cell fractions, by imaging approaches in fixed cells or tissues or by life-cell imaging of GFP fusion proteins (Single 1998; Modjtahedi 2006). An alternative approach is to measure the accessibility of cobalt to the mitochondrial matrix in a calcein fluorescence quenching assay in live permeabilized cells (Petronilli et al., 1999).
2. mtDNA damage as a biomarker of mitochondrial dysfunction.
Various quantitative polymerase chain reaction (QPCR)-based assays have been developed to detect changes of DNA structure and sequence in the mitochondrial genome. mtDNA damage can be detected in blood after low-level rotenone exposure, and the damage persists even after CI activity has returned to normal. With a more sustained rotenone exposure, mtDNA damage is also detected in skeletal muscle. These data support the idea that mtDNA damage in peripheral tissues in the rotenone model may provide a biomarker of past or ongoing mitochondrial toxin exposure (Sanders et al., 2014a and 2014b).
3. Generation of ROS and resultant oxidative stress.
a. General approach. Electrons from the mitochondrial ETS may be transferred ‘erroneously’ to molecular oxygen to form superoxide anions. This type of side reaction can be strongly enhanced upon mitochondrial damage. As superoxide may form hydrogen peroxide, hydroxyl radicals or other reactive oxygen species, a large number of direct ROS assays and assays assessing the effects of ROS (indirect ROS assays) are available (Adam-Vizi, 2005; Fan and Li 2014). Direct assays are based on the chemical modification of fluorescent or luminescent reporters by ROS species. Indirect assays assess cellular metabolites, the concentration of which is changed in the presence of ROS (e.g. glutathione, malonaldehyde, isoprostanes,etc.) At the animal level the effects of oxidative stress are measured from biomarkers in the blood or urine.
b. Measurement of the cellular glutathione (GSH) status. GSH is regenerated from its oxidized form (GSSH) by the action of an NADPH dependent reductase (GSSH + NADPH + H+ à 2 GSH + NADP+). The ratio of GSH/GSSG is therefore a good indicator for the cellular NADH+/NADPH ratio (i.e. the redox potential). GSH and GSSH levels can be determined by HPLC, capillary electrophoresis, or biochemically with DTNB (Ellman’s reagent). As excess GSSG is rapidly exported from most cells to maintain a constant GSH/GSSG ratio, a reduction of total glutathione (GSH/GSSG) is often a good surrogate measure for oxidative stress.
c. Quantification of lipid peroxidation. Measurement of lipid peroxidation has historically relied on the detection of thiobarbituric acid (TBA)-reactive compounds such as malondialdehyde generated from the decomposition of cellular membrane lipid under oxidative stress (Pryor et al., 1976). This method is quite sensitive, but not highly specific. A number of commercial assay kits are available for this assay using absorbance or fluorescence detection technologies. The formation of F2-like prostanoid derivatives of arachidonic acid, termed F2-isoprostanes (IsoP) has been shown to be more specific for lipid peroxidation. A number of commercial ELISA kits have been developed for IsoPs, but interfering agents in samples requires partial purification before analysis. Alternatively, GC/MS may be used, as robust (specific) and sensitive method.
d. Detection of superoxide production. Generation of superoxide by inhibition of complex I and the methods for its detection are described by Grivennikova and Vinogradov (2014). A range of different methods is also described by BioTek (http://www.biotek.com/resources/articles/reactive-oxygen-species.html). The reduction of ferricytochrome c to ferrocytochrome c may be used to assess the rate of superoxide formation (McCord, 1968). Like in other superoxide assays, specificity can only be obtained by measurements in the absence and presence of superoxide dismutase. Chemiluminescent reactions have been used for their increased sensitivity. The most widely used chemiluminescent substrate is lucigenin. Coelenterazine has also been used as a chemiluminescent substrate. Hydrocyanine dyes are fluorogenic sensors for superoxide and hydroxyl radical, and they become membrane impermeable after oxidation (trapping at site of formation). The best characterized of these probes are Hydro-Cy3 and Hydro-Cy5. generation of superoxide in mitochondria can be visualized using fluorescence microscopy with MitoSOX™ Red reagent (Life Technologies). MitoSOX™ Red reagent is a cationic derivative of dihydroethidium that permeates live cells and accumulates in mitochondria.
e. Detection of hydrogen peroxide (H2O2) production. There are a number of fluorogenic substrates, which serve as hydrogen donors that have been used in conjunction with horseradish peroxidase (HRP) enzyme to produce intensely fluorescent products in the presence of hydrogen peroxide (Zhou et al., 1997: Ruch et al., 1983). The more commonly used substrates include diacetyldichloro-fluorescein, homovanillic acid, and Amplex® Red. In these examples, increasing amounts of H2O2 form increasing amounts of fluorescent product (Tarpley et al., 2004).
Summing up, mitochondrial dysfunction can be measured by: • ROS production: superoxide (O2-), and hydroxyl radicals (OH−) • Nitrosative radical formation such as ONOO− or directly by: • Loss of mitochondrial membrane potential (MMP) • Opening of mitochondrial permeability transition pores (mPTP) • ATP synthesis • Increase in mitochondrial Ca2+ • Cytochrome c release • AIF (apoptosis inducing factor) release from mitochondria • Mitochondrial Complexes enzyme activity • Measurements of mitochondrial oxygen consumption • Ultrastructure of mitochondria using electron microscope and mitochondrial fragmentation measured by labelling with DsRed-Mito expression (Knott et al, 2008) Mitochondrial dysfunction-induced oxidative stress can be measured by: • Reactive carbonyls formations (proteins oxidation) • Increased 8-oxo-dG immunoreactivity (DNA oxidation) • Lipid peroxidation (formation of malondialdehyde (MDA) and 4- hydroxynonenal (HNE) • 3-nitrotyrosine (3-NT) formation, marker of protein nitration • Translocation of Bid and Bax to mitochondria • Measurement of intracellular free calcium concentration ([Ca2+]i): Cells are loaded with 4 μM fura-2/AM). • Ratio between reduced and oxidized form of glutathione (GSH depletion) (Promega assay, TB369; Radkowsky et al., 1986) • Neuronal nitric oxide synthase (nNOS) activation that is Ca2+-dependent. All above measurements can be performed as the assays for each readout are well established in the existing literature (e.g. Bal-Price and Brown, 2000; Bal-Price et al., 2002; Fujikawa, 2015; Walker et al., 1995). See also KE Oxidative Stress, Increase
|
Assay Type & Measured Content |
Description | Dose Range Studied |
Assay Characteristics (Length/Ease of use/Accuracy) |
|
Rhodamine 123 Assay Measuring Mitochondrial membrane potential (MMP) and its collapse (Shaki et al., 2012) |
Mitochondrial uptake of cationic fluorescent dye, rhodamine 123, is used for estimation of mitochondrial membrane potential. The fluorescence was monitored using Schimadzou RF-5000U fluorescence spectrophotometer at the excitation and emission wavelength of 490 nm and 535 nm, respectively. |
50, 100 and 500 μM of uranyl acetate |
Short / easy Medium accurancy |
|
TMRE fluorescence Assay Measuring Mitochondrial permeability transition pore (mPTP) opening (Huser et al., 1998) |
Laser scanning confocal microscopy in combination with the potentiometric fluorescence dye tetramethylrhodamine ethyl ester to monitor relative changes in membrane potential in single isolated cardiac mitochondria. The cationic dye distributes across the membrane in a voltage-dependent manner. Therefore, the large potential gradient across the inner mitochondrial membrane results in the accumulation of the fluorescent dye within the matrix compartment. Rapid depolarizations are caused by the opening of the transition pore. | 1 µM cyclosporin A |
Short / easy Low accurancy |
|
GSH / GSSG Determination Assay Measuring cellular glutathione (GSH) status; ratio of GSH/GSSG (Owen & Butterfield, 2010; Shaki et al., 2013) |
GSH and GSSG levels are determinted biochemically with DTNB (Ellman’s reagent). The developed yellow color was read at 412 nm on a spectrophotometer. | 100 µM uranyl acetate |
Short / easy Low accurancy |
|
TBARS Assay Quantification of lipid peroxidation (Yuan et al., 2016) |
MDA content, a product of lipid peroxidation, was measured using a thiobarbituric acid reactive substances (TBARS) assay. Briefly, the kidney cells were collected in 1 ml PBS buffer solution (pH 7.4) and sonicated. MDA reacts with thiobarbituric acid forming a colored product which can be measured at an absorbance of 532 nm. | 200, 400, 800 µM uranyl acetate |
Medium / medium High accurancy |
|
Aequorin-based bioluminescence assay Increase in mitochondrial Ca2+ influx (Pozzan & Rudolf, 2009) |
Together with GFP, the aequorin moiety acts as Ca2+ sensor in vivo, which delivers emission energy to the GFP acceptor molecule in a BRET (Bioluminescence Resonance Energy Transfer) process; the Ca2+ can then be visualized with fluorescence microscopy. |
Short / easy Low accurancy |
|
|
Western blot & immunostaining analyses Measuring cytochrome c release (Chen et al., 2000) |
Examining the redistribution of Cyto c in cytosolic and mitochondrial cellular fractions. Cells are homogenized and centrifuged, then prepared for immunoblots. Cellular fractions were washed in PBS and lysed in 1% NP-40 buffer. Cellular proteins were separated by SDS–PAGE, transferred onto nitrocellulose membranes, probed using immunoblot analyses with antibodies specific to cyto c (6581A for Western and 65971A for immunostaining; Pharmingen) |
Short / easy Medium accurancy |
|
|
Quantikine Rat/Mouse Cytochrome c Immunoassay Measuring cytochrome c release (Shaki et al., 2012) |
Cytochrome C release was measured a monoclonal antibody specific for rat/mouse cytochrome c was precoated onto the microplate. Seventy-five microliter of conjugate (containing mono- clonal antibody specific for cytochrome c conjugated to horseradish peroxidase). After 2 h of incubation, the substrate solution (100 μl) was added to each well and incubated for 30 min. After 100 μl of the stop solution was added to each well; the optical density of each well was determined by the aforementioned microplate spectrophotometer set to 450 nm. |
Short / easy Low accurancy |
|
|
Membrane potential and cell viability – Flow Cytometry Measuring cytochrome c release (Kruidering et al., 1997) |
“Dc and viability were determined by analyzing the R123 and propidium iodide fluorescence intensity with a FACScan flow cytometer (Becton Dickinson, San Jose, CA) equipped with an argon laser, with the Lysis software program (Becton Dickinson). R123 is a cationic dye that accumulates in the negatively charged inner side of the mitochondria. When the potential drops, less R123 accumulates in the mitochondria, which results in a lower fluorescence signal. The potential was measured as follows: at the indicated times, a 500-ml sample of the cell suspension was taken and transferred to an Eppendorf minivial. To this sample, 100 ml of 6 mM R123 in buffer D was added. After incubation for 10 min at 37°C, the cell suspension was centrifuged for 5 min at 80 3 g. The cell pellet was resuspended in 200 ml of buffer D, containing 0.2 mM R123 and 10 mM propidium iodide, to prevent loss of R123 and to stain nonviable cells, respectively. The samples were transferred to FACScan tubes and analyzed immediately. Analysis was performed at a flow rate of 60 ml/min. R123 fluorescence was detected by the FL1 detector with an emission detection limit below 560 nm. Propidium iodide fluorescence was detected by the FL3 detector, with emission detection above 620 nm. Per sample 3,000 to 5,000 cells were counted (Van de Water et al., 1993)” |
Short / easy Medium accurancy |
References
Adam-Vizi V. Production of reactive oxygen species in brain mitochondria: contribution by electron transport chain and non-electron transport chain sources. Antioxid Redox Signal. 2005, 7(9-10):1140-1149.
Adam-Vizi, V., & Starkov, A. A. (2010). Calcium and mitochondrial reactive oxygen species generation: How to read the facts. Journal of Alzheimer's Disease : JAD, 20 Suppl 2, S413-S426. doi:10.3233/JAD-2010-100465
Adiele, R. C., Stevens, D., & Kamunde, C. (2012). Differential inhibition of electron transport chain enzyme complexes by cadmium and calcium in isolated rainbow trout (oncorhynchus mykiss) hepatic mitochondria. Toxicological Sciences, 127(1), 110-119. doi:10.1093/toxsci/kfs091
Bal-Price A. and Guy C. Brown. Nitric-oxide-induced necrosis and apoptosis in PC12 cells mediated by mitochondria. J. Neurochemistry, 2000, 75: 1455-1464.
Bal-Price A, Matthias A, Brown GC., Stimulation of the NADPH oxidase in activated rat microglia removes nitric oxide but induces peroxynitrite production. J. Neurochem. 2002, 80: 73-80.
Belyaeva, E. A., Sokolova, T. V., Emelyanova, L. V., & Zakharova, I. O. (2012). Mitochondrial electron transport chain in heavy metal-induced neurotoxicity : Effects of cadmium , mercury , and copper. Thescientificworld, 2012, 1-14. doi:10.1100/2012/136063
Blajszczak, C., & Bonini, M. G. (2017). Mitochondria targeting by environmental stressors: Implications for redox cellular signaling. Toxicology, 391, 84-89. doi:10.1016/j.tox.2017.07.013
Brand MD, Nicholls DG. Assessing mitochondrial dysfunction in cells. Biochem J. 2011 Apr 15;435(2):297-312.
Braun RJ. (2012). Mitochondrion-mediated cell death: dissecting yeast apoptosis for a better understanding of neurodegeneration. Front Oncol 2:182.
Cammen M. Corwin, Susannah Christensen. John P. (1990) Electron transport system (ETS) activity as a measure of benthic macrofaunal metabolism MARINE ECOLOGY PROGRESS SERIES- (65) : 171-182.
Chen, Q., Gong, B., & Almasan, A. (2000). Distinct stages of cytochrome c release from mitochondria: Evidence for a feedback amplification loop linking caspase activation to mitochondrial dysfunction in genotoxic stress induced apoptosis. Cell Death and Differentiation, 7(2), 227-233. doi:10.1038/sj.cdd.4400629
Ciapaite, Lolita Van Eikenhorst, Gerco Bakker, Stephan J.L. Diamant, Michaela. Heine, Robert J Wagner, Marijke J. V. Westerhoff, Hans and Klaas Krab (2005) Modular Kinetic Analysis of the Adenine Nucleotide Translocator–Mediated Effects of Palmitoyl-CoA on the Oxidative Phosphorylation in Isolated Rat Liver Mitochondria Diabetes 54:4 944-951.
Correia SC, Santos RX, Perry G, Zhu X, Moreira PI, Smith MA. (2012). Mitochondrial importance in Alzheimer’s, Huntington’s and Parkinson’s diseases. Adv Exp Med Biol 724:205 – 221.
Cozzolino M, Ferri A, Valle C, Carri MT. (2013). Mitochondria and ALS: implications from novel genes and pathways. Mol Cell Neurosci 55:44 – 49.
Creed S, McKenzie M. Measurement of Mitochondrial Membrane Potential with the Fluorescent Dye Tetramethylrhodamine Methyl Ester (TMRM). Methods Mol Biol. 2019;1928:69-76. doi: 10.1007/978-1-4939-9027-6_5. PMID: 30725451.
Desousa BR, Kim KK, Jones AE, Ball AB, Hsieh WY, Swain P, Morrow DH, Brownstein AJ, Ferrick DA, Shirihai OS, Neilson A, Nathanson DA, Rogers GW, Dranka BP, Murphy AN, Affourtit C, Bensinger SJ, Stiles L, Romero N, Divakaruni AS. Calculation of ATP production rates using the Seahorse XF Analyzer. EMBO Rep. 2023 Oct 9;24(10):e56380. doi: 10.15252/embr.202256380. Epub 2023 Aug 7. PMID: 37548091; PMCID: PMC10561364.
Diepart, C, Verrax, J Calderon, PU, Feron, O., Jordan, BF, Gallez, B (2010) Comparison of methods for measuring oxygen consumption in tumor cells in vitroAnalytical Biochemistry 396 (2010) 250–256.
Espinosa JA, Pohan G, Arkin MR, Markossian S. Real-Time Assessment of Mitochondrial Toxicity in HepG2 Cells Using the Seahorse Extracellular Flux Analyzer. Curr Protoc. 2021 Mar;1(3):e75. doi: 10.1002/cpz1.75. Erratum in: Curr Protoc. 2022 Aug;2(8):e551. doi: 10.1002/cpz1.551. PMID: 33735523.
Farooqui T. and . Farooqui, A. A (2012) Oxidative stress in Vertebrates and Invertebrate: molecular aspects of cell signalling. Wiley-Blackwell,Chapter 27, pp:377- 385.
Fan LM, Li JM. Evaluation of methods of detecting cell reactive oxygen species production for drug screening and cell cycle studies. J Pharmacol Toxicol Methods. 2014 Jul-Aug;70(1):40-7.
Fiskum G. Mitochondrial participation in ischemic and traumatic neural cell death. J Neurotrauma. 2000 Oct;17(10):843-55.
Friberg H, Wieloch T. (2002). Mitochondrial permeability transition in acute neurodegeneration. Biochimie 84:241–250.
Fujikawa DG, The Role of Excitotoxic Programmed Necrosis in Acute Brain Injury. Computational and Structural Biotechnology Journal, 2015, 13: 212–221.
Graier WF, Frieden M, Malli R. (2007). Mitochondria and Ca2+ signaling: old guests, new functions. Pflugers Arch 455:375–396.
Green DR. (1998). Apoptotic pathways: the roads to ruin. Cell 94:695-698.
Grivennikova VG, Vinogradov AD. Generation of superoxide by the mitochondrial Complex I. Biochim Biophys Acta. 2006 May-Jun;1757(5-6):553-61. doi: 10.1016/j.bbabio.2006.03.013. Epub 2006 Apr 17. PMID: 16678117.
Hafner RP, Brown GC, Brand MD: Analysis of the control of respiration rate, phosphorylation rate, proton leak rate and protonmotive force in isolated mitochondria using the ‘top-down’ approach of metabolic control theory. Eur J Biochem188 :313 –319,1990.
Hancock, J. T., Desikan, R., & Neill, S. J. (2001). Role of reactive oxygen species in cell signalling pathways. Biochemical Society Transactions, 29(Pt 2), 345-350. doi:10.1042/0300-5127:0290345 [doi]
Hao, Y., Huang, J., Liu, C., Li, H., Liu, J., Zeng, Y., . . . Li, R. (2016). Differential protein expression in metallothionein protection from depleted uranium-induced nephrotoxicity. Scientific Reports, doi:10.1038/srep38942
Hao, Y., Ren, J., Liu, C., Li, H., Liu, J., Yang, Z., . . . Su, Y. (2014). Zinc protects human kidney cells from depleted uranium induced apoptosis. Basic & Clinical Pharmacology & Toxicology, 114, 271-280. doi:10.1111/bcpt.12167
Hinkle PC (1995) Measurement of ADP/O ratios. In Bioenergetics: A Practical Approach. Brown GC, Cooper CE, Eds. Oxford, U.K., IRL Press, p.5 –6.
Huerta-García, E., Perez-Arizti, J. A., Marquez-Ramirez, S. G., Delgado-Buenrostro, N. L., Chirino, Y. I., Iglesias, G. G., & Lopez-Marure, R. (2014). Titanium dioxide nanoparticles induce strong oxidative stress and mitochondrial damage in glial cells. Free Radical Biology and Medicine, 73, 84-94. doi:10.1016/j.freeradbiomed.2014.04.026
Hüser, J., Rechenmacher, C. E., & Blatter, L. A. (1998). Imaging the permeability pore transition in single mitochondria. Biophysical Journal, 74(4), 2129-2137. doi:10.1016/S0006-3495(98)77920-2
Hynes, J.. Marroquin, L.D Ogurtsov, V.I. Christiansen, K.N. Stevens, G.J. Papkovsky, D.B. Will, Y. (2006)) Investigation of drug-induced mitochondrial toxicity using fluorescence-based oxygen-sensitive probes, Toxicol. Sci. 92 186–200.
James, P.E. Jackson, S.K.. Grinberg, O.Y Swartz, H.M. (1995) The effects of endotoxin on oxygen consumption of various cell types in vitro: an EPR oximetry study, Free Radic. Biol. Med. 18 (1995) 641–647.
Kang J, Pervaiz S. (2012). Mitochondria: Redox Metabolism and Dysfunction. Biochem Res Int 2012:896751.
Kann O, Kovács R. (2007). Mitochondria and neuronal activity. Am J Physiol Cell Physiol 292:C641-576.
Karlsson, H. L., Gustafsson, J., Cronholm, P., & Möller, L. (2009). Size-dependent toxicity of metal oxide particles—A comparison between nano- and micrometer size. Toxicology Letters, 188(2), 112-118. doi:10.1016/j.toxlet.2009.03.014
Knott Andrew B., Guy Perkins, Robert Schwarzenbacher & Ella Bossy-Wetzel. Mitochondrial fragmentation in neurodegeneration. Nature Reviews Neuroscience, 2008, 229: 505-518.
Kruidering, M., Van De Water, B., De Heer, E., Mulder, G. J., & Nagelkerke, J. F. (1997). Cisplatin-induced nephrotoxicity in porcine proximal tubular cells: Mitochondrial dysfunction by inhibition of complexes I to IV of the respiratory chain. The Journal of Pharmacology and Experimental Therapeutics, 280(2), 638-649.
Llaudet E, Hatz S, Droniou M, Dale N. Microelectrode biosensor for real-time measurement of ATP in biological tissue. Anal Chem. 2005, 77(10):3267-73.
Lee HC, Wei YH. (2012). Mitochondria and aging. Adv Exp Med Biol 942:311-327.
Leonard AP, Cameron RB, Speiser JL, Wolf BJ, Peterson YK, Schnellmann RG, Beeson CC, Rohrer B. Quantitative analysis of mitochondrial morphology and membrane potential in living cells using high-content imaging, machine learning, and morphological binning. Biochim Biophys Acta. 2015 Feb;1853(2):348-60. doi: 10.1016/j.bbamcr.2014.11.002. Epub 2014 Nov 13. PMID: 25447550; PMCID: PMC4289477.
Li N, Ragheb K, Lawler G, Sturgis J, Rajwa B, et al. Mitochondrial complex I inhibitor rotenone induces apoptosis through enhancing mitochondrial reactive oxygen species production. J Biol Chem.2003;278:8516–8525.
Lin MT, Beal MF. Mitochondrial dysfunction and oxidative stress in neurodegenerative diseases. Nature 2006. 443:787-795.
Maldonado M, Padavannil A, Zhou L, Guo F, Letts JA. Atomic structure of a mitochondrial complex I intermediate from vascular plants. Elife. 2020 Aug 25;9:e56664. doi: 10.7554/eLife.56664. PMID: 32840211; PMCID: PMC7447434.
Martin LJ. (2011). Mitochondrial pathobiology in ALS. J Bioenerg Biomembr 43:569 – 579.
Martinez-Cruz, Oliviert Sanchez-Paz, Arturo Garcia-Carreño, Fernando Jimenez-Gutierrez, Laura Ma. de los Angeles Navarrete del Toro and Adriana Muhlia-Almazan. Invertebrates Mitochondrial Function and Energetic Challenges (www.intechopen.com), Bioenergetics, Edited by Dr Kevin Clark, ISBN 978-953-51-0090-4, Publisher InTech, 2012, 181-218.
Mathews, C. K., Holde, K. E. van, Appling, D. R., & Anthony-Cahill, S. J. (2013). Biochemistry (4th ed.). Toronto: Pearson.
McBride HM, Neuspiel M, Wasiak S. (2006). Mitochondria: more than just a powerhouse. Curr Biol 16:R551–560.
McCord, J.M. and I. Fidovich (1968) The Reduction of Cytochrome C by Milk Xanthine Oxidase. J. Biol. Chem. 243:5733-5760.
Mei Y, Thompson MD, Cohen RA, Tong X. (2013) Endoplasmic Reticulum Stress and Related Pathological Processes. J Pharmacol Biomed Anal.. 1:100-107.
Miccadei, S., & Floridi, A. (1993). Sites of inhibition of mitochondrial electron transport by cadmium. Elsevier Scientific Publishers Ireland Ltd., 89, 159-167.Xu, X. M., & Møller, S. G. (2010). ROS removal by DJ-1: Arabidopsis as a new model to understand Parkinson's Disease. Plant signaling & behavior, 5(8), 1034–1036. doi:10.4161/psb.5.8.12298
Modjtahedi N, Giordanetto F, Madeo F, Kroemer G. Apoptosis-inducing factor: vital and lethal. Trends Cell Biol. 2006 May;16(5):264-72.
Mookerjee SA, Gerencser AA, Nicholls DG, Brand MD. Quantifying intracellular rates of glycolytic and oxidative ATP production and consumption using extracellular flux measurements. J Biol Chem. 2017 Apr 28;292(17):7189-7207. doi: 10.1074/jbc.M116.774471. Epub 2017 Mar 7. Erratum in: J Biol Chem. 2018 Aug 10;293(32):12649-12652. doi: 10.1074/jbc.AAC118.004855. PMID: 28270511; PMCID: PMC5409486.
Motawe ZY, Abdelmaboud SS, Breslin JW. Evaluation of Glycolysis and Mitochondrial Function in Endothelial Cells Using the Seahorse Analyzer. Methods Mol Biol. 2024;2711:241-256. doi: 10.1007/978-1-0716-3429-5_20. PMID: 37776463; PMCID: PMC11368073.
Nunnari J, Suomalainen A. (2012). Mitochondria: in sickness and in health. Cell 148:1145–1159. Hajnóczky G, Csordás G, Das S, Garcia-Perez C, Saotome M, Sinha Roy S, Yi M. (2006). Mitochondrial calcium signalling and cell death: approaches for assessing the role of mitochondrial Ca2+ uptake in apoptosis. Cell Calcium 40:553-560.
Oliviert Martinez-Cruz, Arturo Sanchez-Paz, Fernando Garcia-Carreño, Laura Jimenez-Gutierrez, Ma. de los Angeles Navarrete del Toro and Adriana Muhlia-Almazan. Invertebrates Mitochondrial Function and Energetic Challenges (www.intechopen.com), Bioenergetics, Edited by Dr Kevin Clark, ISBN 978-953-51-0090-4, Publisher InTech, 2012, 181-218.
Orrenius, S., Gogvadze, V., & Zhivotovsky, B. (2015). Calcium and mitochondria in the regulation of cell death. Biochemical and Biophysical Research Communications, 460(1), 72-81. doi:10.1016/j.bbrc.2015.01.137
Owen, J. B., & Butterfield, D. A. (2010). Measurement of oxidized/reduced glutathione ratio. Methods in Molecular Biology (Clifton, N.J.), 648, 269-277. doi:10.1007/978-1-60761-756-3_18 [doi]
Owens R.G. and King F.D. The measurement of respiratory lectron-transport system activity in marine zooplankton. Mar. Biol. 1975, 30:27-36.
Pan, Y., Leifer, A., Ruau, D., Neuss, S., Bonrnemann, J., Schmid, G., . . . Jahnen-Dechent, W. (2009). Gold nanoparticles of diameter 1.4 nm trigger necrosis by oxidative stress and mitochondrial damage. Small, 5(8), 2067-2076. doi:10.1002/smll.200900466
Petronilli V, Miotto G, Canton M, Brini M, Colonna R, Bernardi P, Di Lisa F: Transient and long-lasting openings of the mitochondrial permeability transition pore can be monitored directly in intact cells by changes in mitochondrial calcein fluorescence. Biophys J 1999, 76:725-734.
Plitzko B, Loesgen S. Measurement of Oxygen Consumption Rate (OCR) and Extracellular Acidification Rate (ECAR) in Culture Cells for Assessment of the Energy Metabolism. Bio Protoc. 2018 May 20;8(10):e2850. doi: 10.21769/BioProtoc.2850. PMID: 34285967; PMCID: PMC8275291.
Pourahmad, J., Ghashang, M., Ettehadi, H. A., & Ghalandari, R. (2006). A search for cellular and molecular mechanisms involved in depleted uranium (DU) toxicity. Environmental Toxicology, 21(4), 349-354. doi:10.1002/tox.20196
Pozzan, T., & Rudolf, R. (2009). Measurements of mitochondrial calcium in vivo. Biochimica Et Biophysica Acta (BBA) - Bioenergetics, 1787(11), 1317-1323. doi:https://doi.org/10.1016/j.bbabio.2008.11.012
Promega GSH-Glo Glutathione Assay Technical Bulletin, TB369, Promega Corporation, Madison, WI.
Pryor, W.A., J.P. Stanley, and E. Blair. (1976) Autoxidation of polyunsaturated fatty acids: II. A Suggested mechanism for the Formation of TBA-reactive materials from prostaglandin-like Endoperoxides. Lipids, 11:370-379.
Radkowsky, A.E. and E.M. Kosower (1986) Bimanes 17. (Haloalkyl)-1,5-diazabicyclo[3.3.O]octadienediones (halo-9,10- dioxabimanes): reactivity toward the tripeptide thiol, glutathione, J. Am. Chem. Soc 108:4527-4531.
Roos, D., Seeger, R., Puntel, R., & Vargas Barbosa, N. (2012). Role of calcium and mitochondria in MeHg-mediated cytotoxicity. Journal of Biomedicine and Biotechnology, 2012, 1-15. doi:10.1155/2012/248764
Ruch, W., P.H. Cooper, and M. Baggiollini (1983) Assay of H2O2 production by macrophages and neutrophils with Homovanillic acid and horseradish peroxidase. J. Immunol Methods 63:347-357.
Sanders LH, McCoy J, Hu X, Mastroberardino PG, Dickinson BC, Chang CJ, Chu CT, Van Houten B, Greenamyre JT. (2014a). Mitochondrial DNA damage: molecular marker of vulnerable nigral neurons in Parkinson's disease. Neurobiol Dis. 70:214-23.
Sanders LH, Howlett EH2, McCoy J, Greenamyre JT. (2014b) Mitochondrial DNA damage as a peripheral biomarker for mitochondrial toxin exposure in rats. Toxicol Sci. Dec;142(2):395-402.
Santos, N. A. G., Catão, C. S., Martins, N. M., Curti, C., Bianchi, M. L. P., & Santos, A. C. (2007). Cisplatin-induced nephrotoxicity is associated with oxidative stress, redox state unbalance, impairment of energetic metabolism and apoptosis in rat kidney mitochondria. Archives of Toxicology, 81(7), 495-504. doi:10.1007/s00204-006-0173-2
Scaduto RC Jr, Grotyohann LW. Measurement of mitochondrial membrane potential using fluorescent rhodamine derivatives. Biophys J. 1999 Jan;76(1 Pt 1):469-77. doi: 10.1016/S0006-3495(99)77214-0. PMID: 9876159; PMCID: PMC1302536.
Senkler J, Senkler M, Braun HP. Structure and function of complex I in animals and plants - a comparative view. Physiol Plant. 2017 Sep;161(1):6-15. doi: 10.1111/ppl.12561. Epub 2017 Apr 26. Erratum in: Physiol Plant. 2018 Nov;164(3):364-365. doi: 10.1111/ppl.12844. PMID: 28261805.
Shaki, F., Hosseini, M. J., Ghazi-Khansari, M., & Pourahmad, J. (2012). Toxicity of depleted uranium on isolated rat kidney mitochondria. Biochimica Et Biophysica Acta - General Subjects, 1820(12), 1940-1950. doi:10.1016/j.bbagen.2012.08.015
Shaki, F., Hosseini, M., Ghazi-Khansari, M., & Pourahmad, J. (2013). Depleted uranium induces disruption of energy homeostasis and oxidative stress in isolated rat brain mitochondria. Metallomics, 5(6), 736-744. doi:10.1039/c3mt00019b
Single B, Leist M, Nicotera P. Simultaneous release of adenylate kinase and cytochrome c in cell death. Cell Death Differ. 1998 Dec;5(12):1001-3.
Tahira Farooqui and Akhlaq A. Farooqui. (2012) Oxidative stress in Vertebrates and Invertebrate: molecular aspects of cell signalling. Wiley-Blackwell,Chapter 27, pp:377- 385.
Tarpley, M.M., D.A. Wink, and M.B. Grisham (2004) Methods for detection of reactive Metabolites of Oxygen and Nitrogen: in vitro and in vivo considerations. Am . J. Physiol Regul Integr Comp Physiol. 286:R431-R444.
Valdebenito GE, Duchen MR. Monitoring Mitochondrial Membrane Potential in Live Cells Using Time-Lapse Fluorescence Imaging. Methods Mol Biol. 2022;2497:319-324. doi: 10.1007/978-1-0716-2309-1_22. PMID: 35771453.
Valko, M., Morris, H., & Cronin, M. T. (2005). Metals, toxicity and oxidative stress. Current Medicinal Chemistry, 12(10), 1161-1208. doi:10.2174/0929867053764635 [doi]
von Heimburg, D. Hemmrich, K. Zachariah S.,. Staiger, H Pallua, N.(2005) Oxygen consumption in undifferentiated versus differentiated adipogenic mesenchymal precursor cells, Respir. Physiol. Neurobiol. 146 (2005) 107–116.
Waerzeggers, Yannic Monfared, Parisa Viel, Thomas Winkeler, Alexandra Jacobs, Andreas H. (2010) Mouse models in neurological disorders: Applications of non-invasive imaging, Biochimica et Biophysica Acta (BBA) - Molecular Basis of Disease, Volume 1802, Issue 10, Pages 819-839.
Walker JE, Skehel JM, Buchanan SK. (1995) Structural analysis of NADH: ubiquinone oxidoreductase from bovine heart mitochondria. Methods Enzymol.;260:14–34.
Wang A, Costello S, Cockburn M, Zhang X, Bronstein J, Ritz B. (2011). Parkinson’s disease risk from ambient exposure to pesticides. Eur J Epidemiol 26:547-555.
Wang, L., Li, J., Li, J., & Liu, Z. (2009). Effects of lead and/or cadmium on the oxidative damage of rat kidney cortex mitochondria. Biol.Trace Elem.Res., 137, 69-78. doi:10.1007/s12011-009-8560-1
Wang Y., and Qin ZH., Molecular and cellular mechanisms of excitotoxic neuronal death, Apoptosis, 2010, 15:1382-1402.
Wieloch T. (2001). Mitochondrial Involvement in Acute Neurodegeneration 52:247–254.
Winklhofer, K. Haass,C (2010) Mitochondrial dysfunction in Parkinson's disease, Biochimica et Biophysica Acta (BBA) - Molecular Basis of Disease, 1802: 29-44.
Wong A, Cortopassi GA. High-throughput measurement of mitochondrial membrane potential in a neural cell line using a fluorescence plate reader. Biochem Biophys Res Commun. 2002 Nov 15;298(5):750-4. doi: 10.1016/s0006-291x(02)02546-9. PMID: 12419317.
Yoo I, Ahn I, Lee J, Lee N. Extracellular flux assay (Seahorse assay): Diverse applications in metabolic research across biological disciplines. Mol Cells. 2024 Aug;47(8):100095. doi: 10.1016/j.mocell.2024.100095. Epub 2024 Jul 18. PMID: 39032561; PMCID: PMC11374971.
Yuan, Y., Zheng, J., Zhao, T., Tang, X., & Hu, N. (2016). Uranium-induced rat kidney cell cytotoxicity is mediated by decreased endogenous hydrogen sulfide (H2S) generation involved in reduced Nrf2 levels. Toxicology Research, 5(2), 660-673. doi:10.1039/C5TX00432B
Zhang, H., Chang, Z., Mehmood, K., Abbas, R. Z., Nabi, F., Rehman, M. U., . . . Zhou, D. (2018). Nano copper induces apoptosis in PK-15 cells via a mitochondria-mediated pathway. Biological Trace Element Research, 181(1), 62-70. doi:10.1007/s12011-017-1024-0
Zhou, M., Z.Diwu, Panchuk-Voloshina, N. and R.P. Haughland (1997), A Stable nonfluorescent derivative of resorufin for the fluorometric determination of trace hydrogen peroxide: application in detecting the activity of phagocyte NADPH oxidase and other oxidases. Anal. Biochem 253:162-168.
Event: 188: Neuroinflammation
Short Name: Neuroinflammation
Event Component
| Process | Object | Action |
|---|---|---|
| brain inflammation | microglial cell | pathological |
| brain inflammation | astrocyte | pathological |
AOPs Including This Key Event
Stressors
| Name |
|---|
| SARS-CoV |
| Sars-CoV-2 |
| Chemical |
| Virus |
| bacteria |
Biological Context
| Level of Biological Organization |
|---|
| Tissue |
Organ term
| Organ term |
|---|
| brain |
Domain of Applicability
Taxonomic Applicability| Term | Scientific Term | Evidence | Links |
|---|---|---|---|
| rat | Rattus norvegicus | High | NCBI |
| mouse | Mus musculus | High | NCBI |
| human | Homo sapiens | Moderate | NCBI |
| zebrafish | Danio rerio | Low | NCBI |
| Macaca fascicularis | Macaca fascicularis | Moderate | NCBI |
| Life Stage | Evidence |
|---|---|
| During brain development, adulthood and aging | High |
| Sex | Evidence |
|---|---|
| Mixed | High |
Neuroinflammation is observed in human, monkey, rat, mouse, and zebrafish, in association with neurodegeneration or following toxicant exposure, or SARS-CoV-2 and other coronavirus infection. Some references (non-exhaustive list) are given below for illustration:
Human: Vennetti et al., 2006
Monkey (Macaca fascicularis): Charleston et al., 1994, 1996
Rat: Little et al., 2012; Zurich et al., 2002; Eskes et al., 2002
Mouse: Liu et al., 2012
Zebrafish: Xu et al., 2014.
Key Event Description
Neuroinflammation or brain inflammation differs from peripheral inflammation in that the vascular response and the role of peripheral bone marrow-derived cells are less conspicuous. The most easily detectable feature of neuroinflammation is activation of microglial cells and astrocytes. It is evidenced by changes in shape, increased expression of certain antigens, and accumulation and proliferation of the glial cells in affected regions (Aschner, 1998; Graeber & Streit, 1990; Monnet-Tschudi et al, 2007; Streit et al, 1999; Kraft and Harry, 2011; Claycomb et al., 2013). Upon stimulation by cytokines or inflammogens (e.g. from pathogens or from damaged neurons), both glial cell types activate inflammatory signalling pathways, which result in increased expression and/or release of inflammatory mediators such as cytokines, eicosanoids, and metalloproteinases (Dong & Benveniste, 2001), as well as in the production of reactive oxygen (ROS) and nitrogen species (RNS) (Brown & Bal-Price, 2003). Different types of activation states are possible for microglia and astrocytes, resulting in pro-inflammatory or anti-inflammatory signalling and other cellular functions (such as phagocytosis) (Streit et al., 1999; Nakajima and Kohsaka, 2004).
Therefore, neuroinflammation can have both neuroprotective/neuroreparative and neurodegenerative consequences (Carson et al., 2006 ; Monnet-Tschudi et al, 2007; Aguzzi et al., 2013 ; Glass et al., 2010). Under normal physiological conditions, microglial cells scan the nervous system for neuronal integrity (Nimmerjahn et al, 2005) and for invading pathogens (Aloisi, 2001; Kreutzberg, 1995; Kreutzberg, 1996; Rivest, 2009). They are the first type of cell activated (first line of defence), and can subsequently induce astrocyte activation (Falsig, 2008). Two distinct states of microglial activation have been described (Gordon, 2003; Kigerl et al, 2009; Maresz et al, 2008; Mosser & Edwards, 2008; Perego et al; Ponomarev et al, 2005; Moehle and West, 2015): The M1 state is classically triggered by interferon-gamma and/or other pro-inflammatory cytokines, and this state is characterized by increased expression of integrin alpha M (Itgam) and CD86, as well as the release of pro-inflammatory cytokines (TNF-alpha, IL-1beta, IL-6), and it is mostly associated with neurodegeneration. The M2 state is triggered by IL-4 and IL-13 (Maresz et al, 2008; Perego et al, 2011; Ponomarev et al, 2007) and induces the expression of mannose receptor 1 (MRC1), arginase1 (Arg 1) and Ym1/2; it is involved in repair processes. The activation of astrocytes by microglia-derived cytokines or TLR agonists resembles the microglial M1 state (Falsig 2006). Although classification of the M1/M2 polarization of microglial cells may be considered as a simplification of authentic microglial reaction states (Ransohoff, 2016), a similar polarization of reactive astrocytes has been descibed recently Liddlelow et al., 2017): Interleukin-1 alpha (IL-1alpha), TNF and subcomponent q (C1q) released by activated microglial cells induce A1-reactive astrocytes, which lose the ability to promote neuronal survival, outgrowth, synaptogenesis and phagocytosis and induce the death of neurons and oligodendrocytes.
Neuroinflammation and Brain development
During brain development, microglia are known to play a critical role as shapers of neural circuits, by providing trophic factors and by remodeling and pruning synapses (Rajendran and Paolicelli, 2018). In addition to playing a role in synaptic management, microglia are important for the pruning of dying neurons and in the clearance of debris (Harry, 2013). Microglia seem to affect also processes associated with neuronal proliferation and differentiation (Harry and Kraft, 2012). Similarly to microglia, astrocytes have instructive roles in neurogenesis, gliogenesis, angiogenesis, axonal outgrowth, synaptogenesis, and synaptic pruning (Reemst et al., 2016).
The development-dependent reactivity of microglial cells and astrocytes is not well known. Ischemic insult appears to elicit similar microglial reactivity both during brain development and in adulthood (Baburamani et al, 2014; Leonardo & Pennypacker, 2009). In contrast, treatment with lead acetate was previously shown to result in a more pronounced microglial and astrocyte reactivity in immature 3D rat brain cell cultures as compared to mature ones (Zurich et al, 2002). Astrocyte reactivity was also more pronounced in immature 3D rat brain cell cultures following paraquat exposure, whereas development-dependent differences in the phenotype of reactive microglia were observed (Sandström et al., 2017). This suggests that neuroinflammation is occurring during brain development and may express a different phenotype than in adulthood, and that dysfunction of microglia and astrocyte during brain development could contribute to neurodevelopmental disorders and potentially to late-onset neuropathology (Reemst et al., 2016).
Neuroinflammation in relation to COVID19
SARS-CoV-2 patients with moderate and severe COVID-19 presented an elevated plasma levels of glial fibrillary acidic protein (GFAP), which is known as biochemical indicator of glial activation (Kanberg et al., 2020).
How it is Measured or Detected
Neuroinflammation, i.e. the activation of glial cells can be measured by quantification of cellular markers (most commonly), or of released mediators (less common). As multiple activation states exist for the two main cell types involved, it is necessary to measure several markers of neuroinflammation:
- Microglial activation can be detected based on the increased numbers of labeled microglia per volume element of brain tissue (due to increase of binding sites, proliferation, and immigration of cells) or on morphological changes. A specific microglial marker, used across different species, is CD11b. Alternatively various specific carbohydrate structures can be stained by lectins (e.g. IB4). Beyond that, various well-established antibodies are available to detect microglia in mouse tissue (F4/80), phagocytic microglia in rat tissue (ED1) or more generally microglia across species (Iba1). Transgenic mice are available with fluorescent proteins under the control of the CD11b promoter to easily quantify microglia without the need for specific stains.
- The most frequently used astrocyte marker is GFAP (99% of all studies) (Eng et al., 2000). This protein is highly specific for astrocytes in the brain, and antibodies are available for immunocytochemical detection. In neuroinflammatory brain regions, the stain becomes more prominent, due to an upregulation of the protein, a shape change/proliferation of the cells, and/or better accessibility of the antibody. Various histological quantification approaches can be used. Occasionally, alternative astrocytic markers, such as vimentin of the S100beta protein, have been used for staining of astrocytes (Struzynska et al., 2007). Antibodies for complement component 3 (C3), the most characteristic and highly upregulated marker of A1 neurotoxic reactive astrocytes are commercially available.
- All immunocytochemical methods can also be applied to cell culture models.
- In patients, microglial accumulation can be monitored by PET imaging, using [11C]-PK 11195 as a microglial marker (Banati et al., 2002).
- Activation of glial cells can be assessed in tissue or cell culture models also by quantification of sets of activation markers. This can for instance be done by PCR quantification of inflammatory factors, by measurement of the respective mediators, e.g. by ELISA-related immuno-quantification. Such markers include:
- Pro- and anti-inflammatory cytokine expression (IL-1β; TNF-α, Il-6, IL-4); or expression of immunostimmulatory proteins (e.g. MHC-II)
- Itgam, CD86 expression as markers of M1 microglial phenotype
- Arg1, MRC1, as markers of M2 microglial phenotype
For descriptions of techniques, see Falsig 2004; Lund 2006 ; Kuegler 2010; Monnet-Tschudi et al., 2011; Sandström et al., 2014; von Tobel et al., 2014
Regulatory example using the KE
Measurement of glial fibrillary acidic protein (GFAP) in brain tissue, whose increase is a marker of astrocyte reactivity, is required by the US EPA in rodent toxicity studies for fuel additives (40 CFR 79.67). It has been used on rare occasions for other toxicant evaluations.
References
Aguzzi, A., Barres, B.A., Bennett, M.L., 2013. Microglia: scapegoat, saboteur, or something else? Science 339(6116), 156-161.
Aloisi, F., 2001. Immune function of microglia. Glia 36, 165-179.
Aschner M (1998) Immune and inflammatory responses in the CNS: modulation by astrocytes. ToxicolLett 103: 283-287
Banati, R. B. (2002). "Visualising microglial activation in vivo." Glia 40: 206-217.
Baburamani AA, Supramaniam VG, Hagberg H, Mallard C (2014) Microglia toxicity in preterm brain injury. Reprod Toxicol 48: 106-112
Brown GC, Bal-Price A (2003) Inflammatory neurodegeneration mediated by nitric oxide, glutamate, and mitochondria. Mol Neurobiol 27: 325-355
Carson, M.J., Thrash, J.C., Walter, B., 2006. The cellular response in neuroinflammation: The role of leukocytes, microglia and astrocytes in neuronal death and survival. Clin Neurosci Res 6(5), 237-245.
Charleston JS, Body RL, Bolender RP, Mottet NK, Vahter ME, Burbacher TM. 1996. Changes in the number of astrocytes and microglia in the thalamus of the monkey Macaca fascicularis following long-term subclinical methylmercury exposure. NeuroToxicology 17: 127-138.
Charleston JS, Bolender RP, Mottet NK, Body RL, Vahter ME, Burbacher TM. 1994. Increases in the number of reactive glia in the visual cortex of Macaca fascicularis following subclinical long-term methyl mercury exposure. ToxicolApplPharmacol 129: 196-206.
Claycomb, K.I., Johnson, K.M., Winokur, P.N., Sacino, A.V., Crocker, S.J., 2013. Astrocyte regulation of CNS inflammation and remyelination. Brain Sci 3(3), 1109-1127.
Dong Y, Benveniste EN (2001) Immune Function of Astrocytes. Glia 36: 180-190
Eng LF, Ghirnikar RS, Lee YL (2000) Glial Fibrillary Acidic Protein: GFAP-Thirty-One Years (1969-2000). NeurochemRes 25: 1439-1451
Eskes C, Honegger P, Juillerat-Jeanneret L, Monnet-Tschudi F. 2002. Microglial reaction induced by noncytotoxic methylmercury treatment leads to neuroprotection via interactions with astrocytes and IL-6 release. Glia 37(1): 43-52.
Falsig J, Latta M, Leist M. Defined inflammatory states in astrocyte cultures correlation with susceptibility towards CD95-driven apoptosis. J Neurochem. 2004 Jan;88(1):181-93.
Falsig J, Pörzgen P, Lund S, Schrattenholz A, Leist M. The inflammatory transcriptome of reactive murine astrocytes and implications for their innate immune function. J Neurochem. 2006 Feb;96(3):893-907.
Falsig J, van Beek J, Hermann C, Leist M. Molecular basis for detection of invading pathogens in the brain. J Neurosci Res. 2008 May 15;86(7):1434-47.
Glass CK, Saijo K, Winner B, Marchetto MC, Gage FH (2010). Mechanisms underlying inflammation in neurodegeneration. Cell. 2010 Mar 19;140(6):918-34.
Gordon S (2003) Alternative activation of macrophages. Nat Rev Immunol 3: 23-35
Graeber MB, Streit WJ (1990) Microglia: immune network in the CNS. Brain Pathol 1: 2-5
Harry GJ and Kraft AD (2012) Microglia in the developing brain: apotential target with lifetime effects. Neurotoxicology. 33(2):191-206.
Harry GJ (2013) Microglia during development and aging. Pharmacology & therapeutics 139: 313-326
Kanberg N, et al. Neurochemical evidence of astrocytic and neuronal injury commonly found in COVID-19. Neurology. 2020 Sep 22;95(12):e1754-e1759
Kigerl KA, Gensel JC, Ankeny DP, Alexander JK, Donnelly DJ, Popovich PG (2009) Identification of two distinct macrophage subsets with divergent effects causing either neurotoxicity or regeneration in the injured mouse spinal cord. J Neurosci 29: 13435-13444
Kraft AD, Harry GJ., Features of microglia and neuroinflammation relevant to environmental exposure and neurotoxicity. International Journal of Environmental research and Public Health., 2011, 8(7): 2980-3018.
Kreutzberg GW (1995) Microglia, the first line of defence in brain pathologies. Arzneimttelforsch 45: 357-360
Kreutzberg GW (1996) Microglia : a sensor for pathological events in the CNS. Trends Neurosci 19: 312-318
Kuegler PB, Zimmer B, Waldmann T, Baudis B, Ilmjärv S, Hescheler J, Gaughwin P, Brundin P, Mundy W, Bal-Price AK, Schrattenholz A, Krause KH, van Thriel C, Rao MS, Kadereit S, Leist M. Markers of murine embryonic and neural stem cells, neurons and astrocytes: reference points for developmental neurotoxicity testing. ALTEX. 2010;27(1):17-42
Leonardo CC, Pennypacker KR (2009) Neuroinflammation and MMPs: potential therapeutic targets in neonatal hypoxic-ischemic injury. J Neuroinflammation 6: 13
Liddelow SA, Guttenplan KA, Clarke LE, Bennett FC, Bohlen CJ, Schirmer L, et al. 2017. Neurotoxic reactive astrocytes are induced by activated microglia. Nature 541(7638): 481-487.
Little AR, Miller DB, Li S, Kashon ML, O'Callaghan JP. 2012. Trimethyltin-induced neurotoxicity: gene expression pathway analysis, q-RT-PCR and immunoblotting reveal early effects associated with hippocampal damage and gliosis. Neurotoxicol Teratol 34(1): 72-82.
Liu Y, Hu J, Wu J, Zhu C, Hui Y, Han Y, et al. 2012. alpha7 nicotinic acetylcholine receptor-mediated neuroprotection against dopaminergic neuron loss in an MPTP mouse model via inhibition of astrocyte activation. J Neuroinflammation 9: 98.
Lund S, Christensen KV, Hedtjärn M, Mortensen AL, Hagberg H, Falsig J, Hasseldam H, Schrattenholz A, Pörzgen P, Leist M. The dynamics of the LPS triggered inflammatory response of murine microglia under different culture and in vivo conditions. J Neuroimmunol. 2006 Nov;180(1-2):71-87.
Maresz K, Ponomarev ED, Barteneva N, Tan Y, Mann MK, Dittel BN (2008) IL-13 induces the expression of the alternative activation marker Ym1 in a subset of testicular macrophages. J Reprod Immunol 78: 140-148
Moehle MS, West AB (2015) M1 and M2 immune activation in Parkinson's Disease: Foe and ally? Neuroscience 302:59-73 doi:10.1016/j.neuroscience.2014.11.018
Monnet-Tschudi F, Zurich MG, Honegger P (2007) Neurotoxicant-induced inflammatory response in three-dimensional brain cell cultures. Hum Exp Toxicol 26: 339-346
Monnet-Tschudi, F., A. Defaux, et al. (2011). "Methods to assess neuroinflammation." Curr Protoc Toxicol Chapter 12: Unit12 19.
Mosser DM, Edwards JP (2008) Exploring the full spectrum of macrophage activation. Nat Rev Immunol 8: 958-969
Nakajima K, Kohsaka S. 2004. Microglia: Neuroprotective and neurotrophic cells in the central nervous system. Current Drug Targets-Cardiovasc & Haematol Disorders 4: 65-84.
Perego C, Fumagalli S, De Simoni MG (2011) Temporal pattern of expression and colocalization of microglia/macrophage phenotype markers following brain ischemic injury in mice. J Neuroinflammation 8: 174
Ponomarev ED, Maresz K, Tan Y, Dittel BN (2007) CNS-derived interleukin-4 is essential for the regulation of autoimmune inflammation and induces a state of alternative activation in microglial cells. J Neurosci 27: 10714-10721
Ponomarev ED, Shriver LP, Maresz K, Dittel BN (2005) Microglial cell activation and proliferation precedes the onset of CNS autoimmunity. J Neurosci Res 81: 374-389
Rajendran L1, Paolicelli RC (2018). Microglia-Mediated Synapse Loss in Alzheimer's Disease. J Neurosci. 38:2911-2919.
Ransohoff RM. 2016. A polarizing question: do M1 and M2 microglia exist? Nat Neurosci 19(8): 987-991.
Reemst K, Noctor SC, Lucassen PJ, Hol EM. (2016) The Indispensable Roles of Microglia and Astrocytes during Brain Development. Front Hum Neurosci. 10:566. DOI:10.3389/fnhum.2016.00566
Rivest, S., 2009. Regulation of innate immune responses in the brain. Nat Rev Immunol 9(6), 429-439.
Sandstrom von Tobel, J., D. Zoia, et al. (2014). "Immediate and delayed effects of subchronic Paraquat exposure during an early differentiation stage in 3D-rat brain cell cultures." Toxicol Lett. DOI : 10.1016/j.toxlet.2014.02.001
Sandstrom J, Broyer A, Zoia D, et al. (2017a) Potential mechanisms of development-dependent adverse effects of the herbicide paraquat in 3D rat brain cell cultures. Neurotoxicology 60:116-124 doi:10.1016/j.neuro.2017.04.010
Sandstrom J, Eggermann E, Charvet I, et al. (2017b) Development and characterization of a human embryonic stem cell-derived 3D neural tissue model for neurotoxicity testing. Toxicol In Vitro 38:124-135 doi:10.1016/j.tiv.2016.10.001
Streit, W.J., Walter, S.A., Pennell, N.A., 1999. Reactive microgliosis. Progress in Neurobiol. 57, 563-581.
Struzynska L, Dabrowska-Bouta B, Koza K, Sulkowski G (2007) Inflammation-Like Glial Response in Lead-Exposed Immature Rat Brain. Toxicol Sc 95:156-162
Venneti S, Lopresti BJ, Wiley CA. 2006. The peripheral benzodiazepine receptor (Translocator protein 18kDa) in microglia: from pathology to imaging. Prog Neurobiol 80(6): 308-322.
von Tobel, J. S., P. Antinori, et al. (2014). "Repeated exposure to Ochratoxin A generates a neuroinflammatory response, characterized by neurodegenerative M1 microglial phenotype." Neurotoxicology 44C: 61-70.
Xu DP, Zhang K, Zhang ZJ, Sun YW, Guo BJ, Wang YQ, et al. 2014. A novel tetramethylpyrazine bis-nitrone (TN-2) protects against 6-hydroxyldopamine-induced neurotoxicity via modulation of the NF-kappaB and the PKCalpha/PI3-K/Akt pathways. Neurochem Int 78: 76-85.
Zurich M-G, Eskes C, Honegger P, Bérode M, Monnet-Tschudi F. 2002. Maturation-dependent neurotoxicity of lead aceate in vitro: Implication of glial reactions. J Neurosc Res 70: 108-116.
Event: 386: Decrease of neuronal network function
Short Name: Neuronal network function, Decreased
Event Component
| Process | Object | Action |
|---|---|---|
| synaptic signaling | decreased |
AOPs Including This Key Event
Biological Context
| Level of Biological Organization |
|---|
| Organ |
Organ term
| Organ term |
|---|
| brain |
Domain of Applicability
Taxonomic Applicability| Term | Scientific Term | Evidence | Links |
|---|---|---|---|
| humans | Homo sapiens | High | NCBI |
| rat | Rattus norvegicus | High | NCBI |
| mice | Mus sp. | High | NCBI |
| cat | Felis catus | High | NCBI |
| Life Stage | Evidence |
|---|---|
| During brain development | High |
| Sex | Evidence |
|---|---|
| Mixed | High |
In vitro studies in brain slices applying electrophysiological techniques showed significant variability among species (immature rats, rabbits and kittens) related to synaptic latency, duration, amplitude and efficacy in spike initiation (reviewed in Erecinska et al., 2004).
Key Event Description
Biological state: There are striking differences in neuronal network formation and function among the developing and mature brain. The developing brain shows a slow maturation and a transient passage from spontaneous, long-duration action potentials to synaptically-triggered, short-duration action potentials.
Furthermore, at this precise developmental stage the neuronal network is characterised by "hyperexcitability”, which is related to the increased number of local circuit recurrent excitatory synapses and the lack of γ-amino-butyric acid A (GABAA)-mediated inhibitory function that appears much later. This “hyperexcitability” disappears with maturation when pairing of the pre- and postsynaptic partners occurs and synapses are formed generating population of postsynaptic potentials and population of spikes followed by developmental GABA switch. Glutamatergic neurotransmission is dominant at early stages of development and NMDA receptor-mediated synaptic currents are far more times longer than those in maturation, allowing more calcium to enter the neurons. The processes that are involved in increased calcium influx and the subsequent intracellular events seem to play a critical role in establishment of wiring of neural circuits and strengthening of synaptic connections during development (reviewed in Erecinska et al., 2004). Neurons that do not receive glutaminergic stimulation are undergoing developmental apoptosis.
During the neonatal period, the brain is subject to profound alterations in neuronal circuitry due to high levels of synaptogenesis and gliogenesis. For example, in neuroendocrine regions such as the preoptic area-anterior hypothalamus (POA-AH), the site of gonadotropin-releasing hormone (GnRH) system is developmentally regulated by glutamatergic neurons. The changes in the expression of the N-methyl-D-aspartate (NMDA) receptor subunits NR1 and NR2B system begin early in postnatal development, before the onset of puberty, thereby playing a role in establishing the appropriate environment for the subsequent maturation of GnRH neurons (Adams et al., 1999).
Biological compartments: Neural network formation and function happen in all brain regions but it appears to onset at different time points of development (reviewed in Erecinska et al., 2004). Glutamatergic neurotransmission in hippocampus is poorly developed at birth. Initially, NMDA receptors play important role but the vast majority of these premature glutamatergic synapses are “silent” possibly due to delayed development of hippocampal AMPA receptors. In contrast, in the cerebral cortex the maturation of excitatory glutamatergic neurotransmission happens much earlier. The “silent” synapses disappear by PND 7-8 in both brain regions mentioned above.
There is strong evidence suggesting that NMDA receptor subunit composition controls synaptogenesis and synapse stabilization (Gambrill and Barria, 2011). It is established fact that during early postnatal development in the rat hippocampus, synaptogenesis occurs in parallel with a developmental switch in the subunit composition of NMDA receptors from NR2B to NR2A. It is suggested that early expression of NR2A in organotypic hippocampal slices reduces the number of synapses and the volume and dynamics of spines. In contrast, overexpression of NR2B does not affect the normal number and growth of synapses. However, it does increase spine motility, adding and retracting spines at a higher rate. The C terminus of NR2B, and specifically its ability to bind CaMKII, is sufficient to allow proper synapse formation and maturation. Conversely, the C terminus of NR2A was sufficient to stop the development of synapse number and spine growth. These results indicate that the ratio of synaptic NR2B over NR2A controls spine motility and synaptogenesis, and suggest a structural role for the intracellular C terminus of NR2 in recruiting the signalling and scaffolding molecules necessary for proper synaptogenesis. Interestingly, it was found that genetic deletion of NR3A accelerates glutamatergic synaptic transmission, as measured by AMPAR-mediated postsynaptic currents recorded in hippocampal CA1. Consistent, the deletion of NR3A accelerates the expression of the glutamate receptor subunits NR1, NR2A, and GluR1 sugesting that glutamatergic synapse maturation is critically dependent upon activation of NMDA-type glutamate receptors (Henson et al., 2012).
General role in biology: The development of neuronal networks can be distinguished into two phases: an early ‘establishment’ phase of neuronal connections, where activity-dependent and independent mechanisms could operate, and a later ‘maintenance’ phase, which appears to be controlled by neuronal activity (Yuste and Sur, 1999). These neuronal networks facilitate information flow that is necessary to produce complex behaviors, including learning and memory (Mayford et al., 2012).
How it is Measured or Detected
Methods that have been previously reviewed and approved by a recognized authority should be included in the Overview section above. All other methods, including those well established in the published literature, should be described here. Consider the following criteria when describing each method: 1. Is the assay fit for purpose? 2. Is the assay directly or indirectly (i.e. a surrogate) related to a key event relevant to the final adverse effect in question? 3. Is the assay repeatable? 4. Is the assay reproducible?
In vivo: The recording of brain activity by using electroencephalography (EEG), electrocorticography (ECoG) and local field potentials (LFP) assists towards the collection of signals generated by multiple neuronal cell networks. Advances in computer technology have allowed quantification of the EEG and expansion of quantitative EEG (qEEG) analysis providing a sensitive tool for time-course studies of different compounds acting on neuronal networks' function (Binienda et al., 2011). The number of excitatory or inhibitory synapses can be functionally studied at an electrophysiological level by examining the contribution of glutamatergic and GABAergic synaptic inputs. The number of them can be determined by variably clamping the membrane potential and recording excitatory and inhibitory postsynaptic currents (EPSCs or IPSCs) (Liu, 2004).
In vitro: Microelectrode array (MEA) recordings are also used to measure electrical activity in cultured neurons (Keefer et al., 2001, Gramowski et al., 2000; Gopal, 2003; Johnstone et al., 2010). MEAs can be applied in high throughput platforms to facilitate screening of numerous chemical compounds (McConnell et al., 2012). Using selective agonists and antagonists of different classes of receptors their response can be evaluated in a quantitative manner (Novellino et al., 2011; Hogberg et al., 2011).
Patch clamping technique can also be used to measure neuronal network activity.In some cases, if required, planar patch clamping technique can also be used to measure neuronal networks activity (e.g., Bosca et al., 2014).
References
Adams MM, Flagg RA, Gore AC., Perinatal changes in hypothalamic N-methyl-D-aspartate receptors and their relationship to gonadotropin-releasing hormone neurons. Endocrinology. 1999 May;140(5):2288-96.
Binienda ZK, Beaudoin MA, Thorn BT, Ali SF. (2011) Analysis of electrical brain waves in neurotoxicology: γ-hydroxybutyrate. Curr Neuropharmacol. 9: 236-239.
Bosca, A., M. Martina, and C. Py (2014) Planar patch clamp for neuronal networks--considerations and future perspectives. Methods Mol Biol, 2014. 1183: p. 93-113.
Erecinska M, Cherian S, Silver IA. (2004) Energy metabolism in mammalian brain during development. Prog Neurobiol. 73: 397-445.
Gambrill AC, Barria A. NMDA receptor subunit composition controls synaptogenesis and synapse stabilization. Proc Natl Acad Sci U S A. 2011:108(14):5855-60.
Gopal K. (2003) Neurotoxic effects of mercury on auditory cortex networks growing on microelectrode arrays: a preliminary analysis. Neurotoxicol Teratol. 25: 69-76.
Gramowski A, Schiffmann D, Gross GW. (2000) Quantification of acute neurotoxic effects of trimethyltin using neuronal networks cultures on microelectrode arrays. Neurotoxicology 21: 331-342.
Henson MA, Larsen RS, Lawson SN, Pérez-Otaño I, Nakanishi N, Lipton SA, Philpot BD. (2012) Genetic deletion of NR3A accelerates glutamatergic synapse maturation. PLoS One. 7(8).
Hogberg HT, Sobanski T, Novellino A, Whelan M, Weiss DG, Bal-Price AK. (2011) Application of micro-electrode arrays (MEAs) as an emerging technology for developmental neurotoxicity: evaluation of domoic acid-induced effects in primary cultures of rat cortical neurons. Neurotoxicology 32: 158-168.
Johnstone AFM, Gross GW, Weiss D, Schroeder O, Shafer TJ. (2010) Use of microelectrode arrays for neurotoxicity testing in the 21st century Neurotoxicology 31: 331-350.
Keefer E, Norton S, Boyle N, Talesa V, Gross G. (2001) Acute toxicity screening of novel AChE inhibitors using neuronal networks on microelectrode arrays. Neurotoxicology 22: 3-12.
Liu G. (2004) Local structural balance and functional interaction of excitatory and inhibitory synapses in hippocampal dendrites. Nat Neurosci. 7: 373-379.
Mayford M, Siegelbaum SA, Kandel ER. (2012) Synapses and memory storage. Cold Spring Harb Perspect Biol. 4. pii: a005751.
McConnell ER, McClain MA, Ross J, LeFew WR, Shafer TJ. (2012) Evaluation of multi-well microelectrode arrays for neurotoxicity screening using a chemical training set. Neurotoxicology 33: 1048-1057.
Novellino A, Scelfo B, Palosaari T, Price A, Sobanski T, Shafer TJ, Johnstone AF, Gross GW, Gramowski A, Schroeder O, Jügelt K, Chiappalone M, Benfenati F, Martinoia S, Tedesco MT, Defranchi E, D'Angelo P, Whelan M. (2011) Development of micro-electrode array based tests for neurotoxicity: assessment of interlaboratory reproducibility with neuroactive chemicals. Front Neuroeng. 4: 4.
Yuste R, Peinado A, Katz LC. (1992) Neuronal domains in developing neocortex. Science 257: 665-669.
List of Adverse Outcomes in this AOP
Event: 2416: human amyotrophic lateral sclerosis (ALS)
Short Name: ALS
Event Component
| Process | Object | Action |
|---|---|---|
| Amyotrophic lateral sclerosis | adult central nervous system | occurrence |
AOPs Including This Key Event
| AOP ID and Name | Event Type |
|---|---|
| Aop:636 - Increase in reactive oxygen species (ROS) leading to human amyotrophic lateral sclerosis (ALS) | AdverseOutcome |
Biological Context
| Level of Biological Organization |
|---|
| Individual |
Domain of Applicability
Taxonomic Applicability| Term | Scientific Term | Evidence | Links |
|---|---|---|---|
| Homo sapiens | Homo sapiens | High | NCBI |
| Life Stage | Evidence |
|---|---|
| Adult | High |
| Sex | Evidence |
|---|---|
| Male | High |
| Female | High |
Taxonomic Applicability
- Primary Taxon: Homo sapiens (NCBI Taxon ID: 9606)
- Secondary / Model Taxa: Mus musculus (House mouse, NCBI Taxon ID: 10090), Rattus norvegicus (Norway rat, NCBI Taxon ID: 10116)
- Scientific Rationale: While human motor neuron physiology, neurofilament composition, and lifespan represent the primary domain, transgenic and knock-in rodent models harboring human ALS-associated mutations (e.g., SOD1 G93A, mutant TARDBP, FUS, C9orf72 repeat expansions) exhibit overlapping phenotypic features of motor neuron degeneration, axonal pathology, and muscle denervation.
Life Stage Applicability
- Domain: Adult, Aging / Senescent (Late adulthood)
- Scientific Rationale: ALS is primarily a late-onset neurodegenerative disorder. The median age of symptom onset in sporadic ALS is typically between 55 and 75 years, although familial forms with high-penetrance genetic mutations can present earlier in young to mid-adulthood (30s to 50s).
Sex Applicability
- Domain: Unspecific (Applies to both sexes)
- Scientific Rationale: ALS affects both males and females. A slight male predominance is clinically observed in sporadic ALS (male-to-female ratio of approximately 1.2:1 to 1.5:1), but the underlying cellular and molecular mechanisms of neurodegeneration operate across both sexes.
Key Event Description
Irreversible motor neuron loss results in widespread denervation of neuromuscular junctions (NMJs), leading to progressive neurogenic skeletal muscle atrophy, fasciculations, and spastic/flaccid paralysis. As degeneration spreads, loss of bulbar and respiratory musculature (notably the diaphragm and intercostal muscles) causes dysarthria, dysphagia, and progressive ventilatory failure. Without mechanical respiratory intervention, this condition typically leads to fatal hypoventilation within 2 to 5 years of clinical onset.
How it is Measured or Detected
- Clinical Rating Scale (ALSFRS-R):
-
- Serial assessment using the Revised ALS Functional Rating Scale (0–48 score), evaluating bulbar, fine motor, gross motor, and respiratory domains.
- Pulmonary Function Testing:
-
- Longitudinal monitoring of forced vital capacity (%FVC in seated and supine positions), slow vital capacity (SVC), and sniff nasal inspiratory pressure (SNIP) to quantify diaphragmatic weakness.
- Electromyography (Needle EMG):
-
- Demonstration of acute active denervation (fibrillation potentials, positive sharp waves) and chronic reinnervation changes (neurogenic motor unit action potentials) according to the Gold Coast and Awaji diagnostic criteria.
- Skeletal Muscle Biopsy Histology:
-
- Verification of neurogenic atrophy characterized by grouped atrophy, small angulated esterase-positive fibers, and target fibers.
Regulatory Significance of the AO
The development of ALS represents an apical neurotoxicological endpoint of paramount regulatory significance, falling directly under international safety assessment and human health protection frameworks:
- Neurotoxicity Hazard Identification and Characterization:
-
- Severe, irreversible neurodegeneration and motor system failure correspond directly to regulatory definitions of cumulative neurotoxicity and delayed neurotoxicity under chemical and pharmaceutical testing frameworks (e.g., OECD Test Guidelines for Neurotoxicity, US EPA Health Effects Test Guidelines, and ICH S7A/S7B safety pharmacology guidelines).
- Support for Integrated Approaches to Testing and Assessment (IATA):
-
- Defining the AO and upstream Key Events facilitates the transition toward New Approach Methodologies (NAMs)—such as human iPSC-derived motor neuron-glial coculture assays, microfluidic neuromuscular junction models, and microelectrode array (MEA) electrophysiology. This enables mechanistic chemical screening and hazard ranking without sole reliance on long-term animal studies.
- Identification of Chemical and Environmental Risk Factors:
-
- Regulatory agencies evaluate environmental contaminants, occupational neurotoxicants (e.g., heavy metals, organophosphates, solvents), and xenobiotics for their potential to trigger or accelerate motor neuron death via proteostasis failure, oxidative stress, and mitochondrial impairment, informing occupational exposure limits and environmental safety thresholds.
- Pharmaceutical and Biotherapeutic Safety:
-
- In drug discovery and preclinical safety evaluations, monitoring intermediate biomarkers aligned with this AO (e.g., elevated biofluid neurofilament light chain [NfL], cryptic exon inclusion) enables early de-risking of therapeutics that could inadvertently induce off-target axonal degeneration or disrupt RNA-binding protein homeostasis.
References
- Cedarbaum, J. M., et al. (1999). The ALSFRS-R: a revised ALS functional rating scale that incorporates assessments of respiratory function. Journal of the Neurological Sciences, 169(1-2), 13–21.
- Shefner, J. M., et al. (2020). A proposal for new diagnostic criteria for ALS: The Gold Coast Criteria. Clinical Neurophysiology, 131(8), 1975–1978.
- de Carvalho, M., et al. (2008). Electrodiagnostic criteria for diagnosis of ALS. Clinical Neurophysiology, 119(3), 497–503.
Appendix 2
List of Key Event Relationships in the AOP
List of Adjacent Key Event Relationships
Relationship: 3496: Increase, ROS leads to Increase, Mitochondrial dysfunction
AOPs Referencing Relationship
| AOP Name | Adjacency | Weight of Evidence | Quantitative Understanding |
|---|---|---|---|
| Mitochondrial complex inhibition leading to liver injury | adjacent | High | High |
| Increase in reactive oxygen species (ROS) leading to human amyotrophic lateral sclerosis (ALS) | adjacent | High |
Relationship: 3767: Increase, Mitochondrial dysfunction leads to Neuroinflammation
AOPs Referencing Relationship
| AOP Name | Adjacency | Weight of Evidence | Quantitative Understanding |
|---|---|---|---|
| Increase in reactive oxygen species (ROS) leading to human amyotrophic lateral sclerosis (ALS) | adjacent | High |
Relationship: 2500: Neuroinflammation leads to Neuronal network function, Decreased
AOPs Referencing Relationship
| AOP Name | Adjacency | Weight of Evidence | Quantitative Understanding |
|---|---|---|---|
| A cholesterol/glucose dysmetabolism initiated Tau-driven AOP toward memory loss (AO) in sporadic Alzheimer's Disease with plausible MIE's plug-ins for environmental neurotoxicants | adjacent | High | |
| Increase in reactive oxygen species (ROS) leading to human amyotrophic lateral sclerosis (ALS) | adjacent | High |
Relationship: 3768: Neuronal network function, Decreased leads to ALS
AOPs Referencing Relationship
| AOP Name | Adjacency | Weight of Evidence | Quantitative Understanding |
|---|---|---|---|
| Increase in reactive oxygen species (ROS) leading to human amyotrophic lateral sclerosis (ALS) | adjacent | High |